Reprinted with permission of the Substance Abuse and Mental Health Services Administration www.SAMHSA.gov
U.S. DEPARTMENT OF HEALTH AND HUMAN SERVICES
Substance Abuse and Mental Health Services Administration
Center for Behavioral Health Statistics and Quality
2. Illicit Drug Use
The National Survey on Drug Use and Health (NSDUH) obtains information on nine categories of illicit drug use: use of marijuana, cocaine, heroin, hallucinogens, and inhalants, as well as the nonmedical use of prescription-type pain relievers, tranquilizers, stimulants, and sedatives. In these categories, hashish is included with marijuana, and crack is considered a form of cocaine. Several drugs are grouped under the hallucinogens category, including LSD, PCP, peyote, mescaline, psilocybin mushrooms, and “Ecstasy” (MDMA). Inhalants include a variety of substances, such as nitrous oxide, amyl nitrite, cleaning fluids, gasoline, spray paint, other aerosol sprays, and glue. Respondents are asked to report use of inhalants to get high but not to report times when they accidentally inhaled a substance.
The four categories of prescription-type drugs (pain relievers, tranquilizers, stimulants, and sedatives) cover numerous medications that currently are or have been available by prescription. They also include drugs within these groupings that originally were prescription medications but currently may be manufactured and distributed illegally, such as methamphetamine, which is included under stimulants. Respondents are asked to report only “nonmedical” use of these drugs, defined as use without a prescription of the individual’s own or simply for the experience or feeling the drugs caused. Use of over-the-counter drugs and legitimate use of prescription drugs are not included. NSDUH reports combine the four prescription-type drug groups into a category referred to as “psychotherapeutics.”
Estimates of “illicit drug use” reported from NSDUH reflect the use of any of the nine drug categories listed above. Use of alcohol and tobacco products, while illegal for youths, is not included in these estimates, but is discussed in Chapters 3 and 4.
- In 2011, an estimated 22.5 million Americans aged 12 or older were current (past month) illicit drug users, meaning they had used an illicit drug during the month prior to the survey interview (Figure 2.1). This estimate represents 8.7 percent of the population aged 12 or older.
Below is a bar graph. Click here for the text describing this graph.
Figure 2.1 Past Month Illicit Drug Use among Persons Aged 12 or Older: 2011

1 Illicit Drugs include marijuana/hashish, cocaine (including crack), heroin, hallucinogens, inhalants, or prescription-type psychotherapeutics used nonmedically.
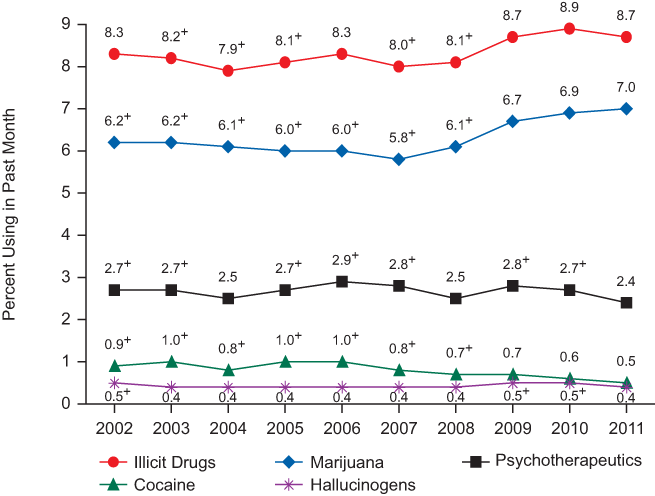
- The overall rate of current illicit drug use among persons aged 12 or older in 2011 (8.7 percent) was similar to the rates in 2010 (8.9 percent), 2009 (8.7 percent), and 2002 (8.3 percent), but it was higher than the rates in most years from 2003 through 2008 (Figure 2.2).
Below is a line graph. Click here for the text describing this graph.
Figure 2.2 Past Month Use of Selected Illicit Drugs among Persons Aged 12 or Older: 2002-2011
+Difference between this estimate and the 2011 estimate is statistically significant at the .05 level.
- In 2011, marijuana was the most commonly used illicit drug, with 18.1 million current users. It was used by 80.5 percent of current illicit drug users. About two thirds (64.3 percent) of illicit drug users used only marijuana in the past month. Also, in 2011, 8.0 million persons aged 12 or older were current users of illicit drugs other than marijuana (or 35.7 percent of illicit drug users aged 12 or older). Current use of other drugs but not marijuana was reported by 19.5 percent of illicit drug users, and 16.2 percent of illicit drug users reported using both marijuana and other drugs.
- The number and percentage of persons aged 12 or older who were current users of marijuana in 2011 (18.1 million or 7.0 percent) were similar to the estimates for 2010 (17.4 million or 6.9 percent). The 2011 rate of current marijuana use also was similar to the rate in 2009 (6.7 percent), but it was higher than those in 2002 through 2008. Between 2007 and 2011, for example, the rate of use increased from 5.8 to 7.0 percent, and the number of users increased from 14.5 million to 18.1 million.
- An estimated 8.0 million people aged 12 or older (3.1 percent) were current users of illicit drugs other than marijuana in 2011. The majority of these users (6.1 million persons or 2.4 percent of the population) were nonmedical users of psychotherapeutic drugs, including 4.5 million users of pain relievers, 1.8 million users of tranquilizers, 970,000 users of stimulants, and 231,000 users of sedatives.
- The number and percentage of persons aged 12 or older who were current nonmedical users of psychotherapeutic drugs in 2011 (6.1 million or 2.4 percent) were lower than those in 2010 (7.0 million or 2.7 percent) and 2009 (7.0 million or 2.8 percent) (Figure 2.2).
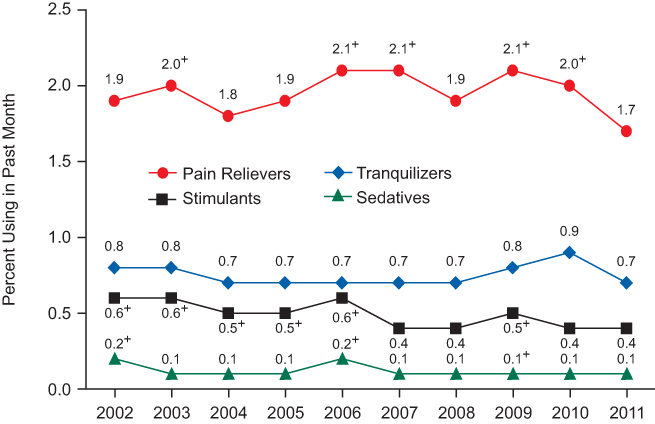
- The number and percentage of persons aged 12 or older who were current nonmedical users of pain relievers in 2011 (4.5 million or 1.7 percent) were lower than those in 2010 (5.1 million or 2.0 percent) and 2009 (5.3 million or 2.1 percent) (Figure 2.3).
Below is a line graph. Click here for the text describing this graph.
Figure 2.3 Past Month Nonmedical Use of Types of Psychotherapeutic Drugs among Persons Aged 12 or Older: 2002-2011
+ Difference between this estimate and the 2011 estimate is statistically significant at the .05 level.
- The number and percentage of persons aged 12 or older who were current nonmedical users of stimulants in 2011 (970,000 or 0.4 percent) were similar to those in 2010 (1.1 million or 0.4 percent), but lower than those in 2009 (1.3 million or 0.5 percent).
- The number and percentage of persons aged 12 or older who were current users of methamphetamine in 2011 (439,000 or 0.2 percent) were similar to those from 2007 through 2010, but lower than those from 2002 through 2006. The previous numbers and percentages were 353,000 (0.1 percent) in 2010, 502,000 (0.2 percent) in 2009, 314,000 (0.1 percent) in 2008, 530,000 (0.2 percent) in 2007, 731,000 (0.3 percent) in 2006, 628,000 (0.3 percent) in 2005, 706,000 (0.3 percent) in 2004, 726,000 (0.3 percent) in 2003, and 683,000 (0.3 percent) in 2002.
- The number and percentage of persons aged 12 or older who were current users of cocaine in 2011 (1.4 million or 0.5 percent) were similar to those in 2010 (1.5 million or 0.6 percent) and 2009 (1.6 million or 0.7 percent), but lower than those from 2002 through 2008 (Figure 2.2). The previous numbers and percentages were 1.9 million (0.7 percent) in 2008, 2.1 million (0.8 percent) in 2007, 2.4 million (1.0 percent) in 2006, 2.4 million (1.0 percent) in 2005, 2.0 million (0.8 percent) in 2004, 2.3 million (1.0 percent) in 2003, and 2.0 million (0.9 percent) in 2002.
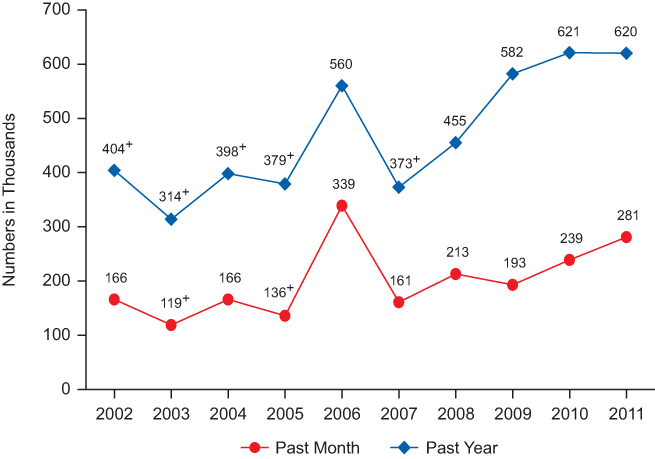
- The number and percentage of persons aged 12 or older who were current heroin users in 2011 (281,000 or 0.1 percent) were similar to those from 2006 through 2010 (239,000 or 0.1 percent in 2010; 193,000 or 0.1 percent in 2009; 213,000 or 0.1 percent in 2008; 161,000 or 0.1 percent in 2007; and 339,000 or 0.1 percent in 2006), but were higher than those in 2005 (136,000 or 0.1 percent) and 2003 (119,000 or 0.1 percent) (Figure 2.4). Additionally, the number and percentage of persons aged 12 or older who were past year heroin users in 2011 (620,000 or 0.2 percent) were similar to those in 2008 to 2010 (621,000 or 0.2 percent in 2010; 582,000 or 0.2 percent in 2009; and 455,000 or 0.2 percent in 2008) and in 2006 (560,000 or 0.2 percent), but were higher than those from 2003 through 2005 and in 2007.
Below is a line graph. Click here for the text describing this graph.
Figure 2.4 Past Month and Past Year Heroin Use among Persons Aged 12 or Older: 2002-2011
+ Difference between this estimate and the 2011 estimate is statistically significant at the .05 level.
- The number and percentage of persons aged 12 or older who were current users of hallucinogens in 2011 (972,000 or 0.4 percent) were lower than those in 2010 (1.2 million or 0.5 percent), 2009 (1.3 million or 0.5 percent), and 2002 (1.2 million or 0.5 percent) (Figure 2.2).
Age
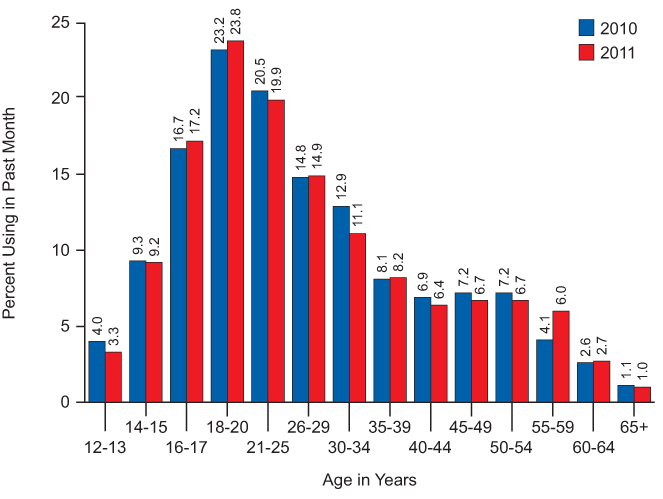
- The rate of current illicit drug use varied by age. Among youths aged 12 to 17 in 2011, the rate increased from 3.3 percent at ages 12 or 13 to 9.2 percent at ages 14 or 15 to 17.2 percent at ages 16 or 17 (Figure 2.5). The highest rate of current illicit drug use was among 18 to 20 year olds (23.8 percent), with the next highest rate among 21 to 25 year olds (19.9 percent). Thereafter, the rate generally declined with age, although not all declines were significant.
Below is a bar graph. Click here for the text describing this graph.
Figure 2.5 Past Month Illicit Drug Use among Persons Aged 12 or Older, by Age: 2010 and 2011
+ Difference between this estimate and the 2011 estimate is statistically significant at the .05 level.
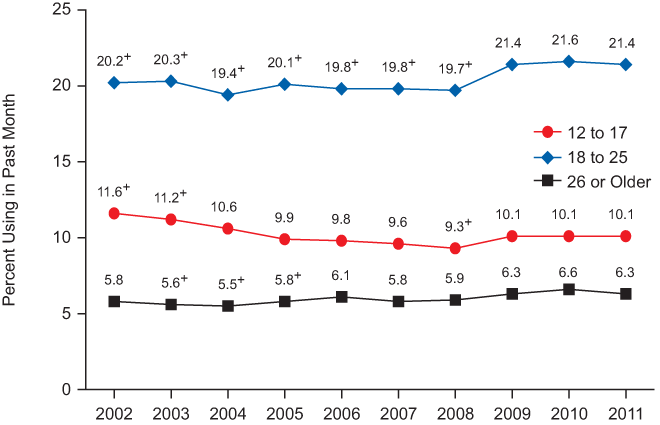
- In 2011, adults aged 26 or older were less likely to be current users of illicit drugs than youths aged 12 to 17 or young adults aged 18 to 25 (6.3 vs. 10.1 and 21.4 percent, respectively) (Figure 2.6). However, there were more current users of illicit drugs aged 26 or older (12.6 million) than users aged 12 to 17 (2.5 million) and users aged 18 to 25 (7.4 million) combined.
Below is a line graph. Click here for the text describing this graph.
Figure 2.6 Past Month Illicit Drug Use among Persons Aged 12 or Older, by Age: 2002-2011
+ Difference between this estimate and the 2011 estimate is statistically significant at the .05 level.
Youths Aged 12 to 17
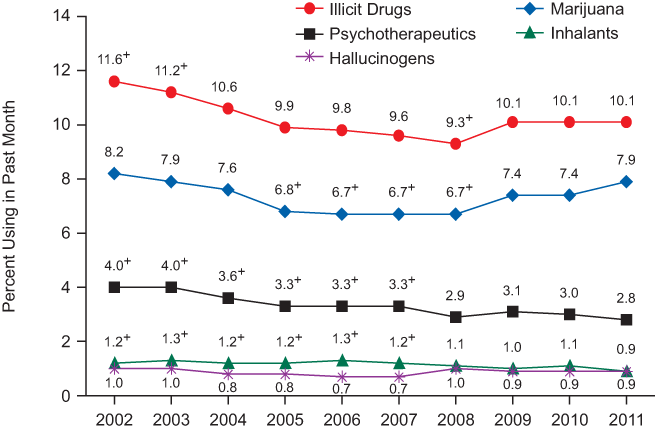
- The rate of current illicit drug use among youths aged 12 to 17 remained unchanged between 2009 and 2011 (10.1 percent in each year), but it was higher than the rate in 2008 (9.3 percent). Between 2002 and 2008, the rate declined from 11.6 to 9.3 percent (Figure 2.7).
Below is a line graph. Click here for the text describing this graph.
Figure 2.7 Past Month Use of Selected Illicit Drugs among Youths Aged 12 to 17: 2002-2011
+ Difference between this estimate and the 2011 estimate is statistically significant at the .05 level.
- In 2011, 10.1 percent of youths aged 12 to 17 were current illicit drug users, with 7.9 percent current users of marijuana, 2.8 percent current nonmedical users of psychotherapeutic drugs, 0.9 percent current users of hallucinogens, 0.9 percent current users of inhalants, and 0.3 percent current users of cocaine.
- Among youths aged 12 to 17, the specific illicit drugs used in the past month varied by age in 2011. Among 12 or 13 year olds, 1.3 percent used marijuana and 1.3 percent used psychotherapeutic drugs nonmedically (which was a decrease from 2.0 percent in 2010, with most of the decrease occurring in the nonmedical use of pain relievers from 1.8 percent in 2010 to 1.1 percent in 2011). Among 14 or 15 year olds, 6.7 percent used marijuana, 2.6 percent used psychotherapeutic drugs nonmedically, and 0.8 percent used hallucinogens. Among 16 or 17 year olds, 15.1 percent used marijuana, 4.2 percent used psychotherapeutic drugs nonmedically, 1.6 percent used hallucinogens, and 0.5 percent used cocaine. Rates of current use of inhalants were 1.0 percent for 12 or 13 year olds, 0.9 percent for 14 or 15 year olds, and 0.7 percent for 16 to 17 year olds.
- After gradually declining from 11.6 percent in 2002 to 9.3 percent in 2008, the rate of current illicit drug use among 12 to 17 year olds increased to 10.1 percent in 2009, 2010, and 2011 (Figure 2.7). Current marijuana use declined from 8.2 percent in 2002 to 6.7 percent in 2008 before increasing to 7.4 percent in 2009 and 2010; the prevalence of current marijuana use in 2011 (7.9 percent) also was greater than that in 2008, but it was similar to the rates in 2009 and 2010. Current nonmedical use of psychotherapeutic drugs declined from 4.0 percent in 2002 and 2003 to 2.8 percent in 2011. This includes the decrease in the current nonmedical use of pain relievers from 3.2 percent in 2002 to 2.3 percent in 2011.
Young Adults Aged 18 to 25
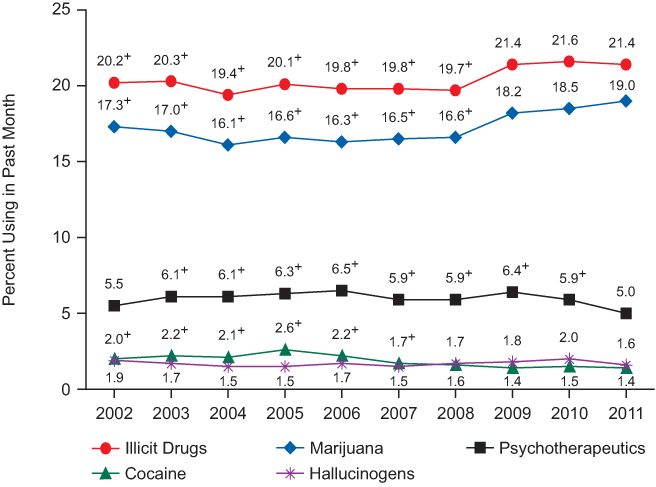
- In 2011, the rate of current illicit drug use was higher among young adults aged 18 to 25 (21.4 percent) than among youths aged 12 to 17 (10.1 percent) and adults aged 26 or older (6.3 percent). Among young adults, the 2011 rate was similar to the 2009 (21.4 percent) and 2010 (21.6 percent) rates, but it was higher than the 2008 rate (19.7 percent) (Figure 2.8).
Below is a line graph. Click here for the text describing this graph.
Figure 2.8 Past Month Use of Selected Illicit Drugs among Young Adults Aged 18 to 25: 2002-2011
+ Difference between this estimate and the 2011 estimate is statistically significant at the .05 level.
- Among young adults, the 2011 rate of current marijuana use (19.0 percent) was similar to the 2009 (18.2 percent) and 2010 (18.5 percent) rates, but it was higher than the 2008 rate (16.6 percent).
- In 2011, the rate of current nonmedical use of psychotherapeutic drugs among young adults aged 18 to 25 was 5.0 percent, which was lower than the rates from 2003 through 2010. Similarly, in 2011, the rate of current nonmedical use of pain relievers was 3.6 percent, which was lower than the rates from 2002 through 2010. Rates of current nonmedical use of pain relievers among young adults for 2002 to 2010 ranged from 4.1 percent in 2002 to 5.0 percent in 2006; the rate in 2010 was 4.4 percent.
- In 2011, the rate of current use of cocaine among young adults aged 18 to 25 was 1.4 percent, which was similar to the rates from 2008 through 2010, but was lower than the rates from 2002 through 2007.
Adults Aged 26 or Older
- In 2011, the rate of current illicit drug use among adults aged 26 or older was 6.3 percent, with 4.8 percent current users of marijuana and 1.9 percent current nonmedical users of psychotherapeutic drugs. Less than 1 percent each were current users of cocaine (0.4 percent), heroin (0.1 percent), and inhalants (0.1 percent). These rates were similar to those in 2009 and 2010. For example, 6.3 percent of adults aged 26 or older in 2009 and 6.6 percent of those in 2010 were current illicit drug users.
- Among adults aged 50 to 59, the rate of current illicit drug use increased from 2.7 to 6.3 percent between 2002 and 2011 (Figure 2.9). For those aged 50 to 54, the rate increased from 3.4 percent in 2002 to 6.7 percent in 2011. Among those aged 55 to 59, current illicit drug use increased from 1.9 percent in 2002 to 6.0 percent in 2011. These patterns and trends partially reflect the aging into these age groups of members of the baby boom cohort, whose rates of illicit drug use have been higher than those of older cohorts. The baby boom cohort refers to persons born in the United States after World War II between 1946 and 1964 (Han, Gfroerer, & Colliver, 2009).
Below is a line graph. Click here for the text describing this graph.
Figure 2.9 Past Month Illicit Drug Use among Adults Aged 50 to 59: 2002-2011
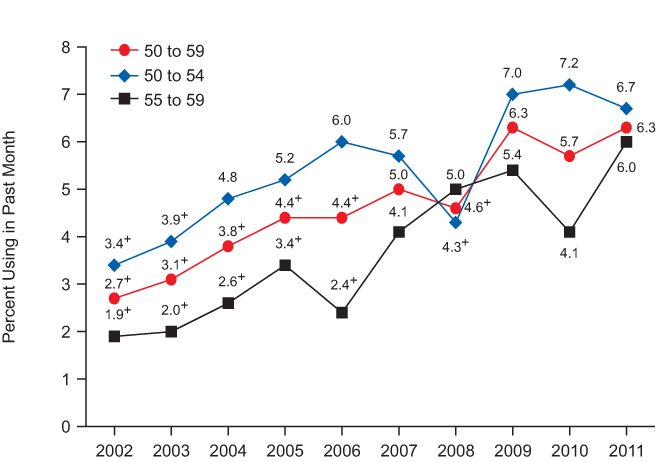
+ Difference between this estimate and the 2011 estimate is statistically significant at the .05 level.
Gender
- In 2011, as in prior years, the rate of current illicit drug use among persons aged 12 or older was higher for males (11.1 percent) than for females (6.5 percent). Males were more likely than females to be current users of several different illicit drugs, including marijuana (9.3 vs. 4.9 percent), nonmedical use of prescription drugs (2.6 vs. 2.2 percent), cocaine (0.7 vs. 0.4 percent), and hallucinogens (0.5 vs. 0.3 percent). The 2011 rates for both males and females aged 12 or older were similar to those reported in 2010, with the exception of a decrease in the current nonmedical use of prescription drugs among females (down from 2.5 percent in 2010).
- In 2011, the rate of current illicit drug use was higher among males aged 12 to 17 than females aged 12 to 17 (10.8 vs. 9.3 percent), which represents a change from 2010, when current illicit drug use did not differ significantly between males and females (10.4 and 9.8 percent). Males aged 12 to 17 also were more likely than females to be current marijuana users (9.0 vs. 6.7 percent). However, females aged 12 to 17 were more likely than males to be current nonmedical users of psychotherapeutic drugs (3.2 vs. 2.4 percent) and current nonmedical users of pain relievers (2.6 vs. 1.9 percent).
- The rate of current marijuana use among males aged 12 to 17 declined from 9.1 percent in 2002 to 6.9 percent in 2006, then increased between 2006 and 2009 (8.4 percent); rates remained stable after 2009 (8.4 percent in 2010 and 9.0 percent in 2011) (Figure 2.10). Among females aged 12 to 17, the rate of current marijuana use changed little between 2002 (7.2 percent) and 2004 (7.1 percent), then declined to 5.8 percent in 2007 before increasing in 2011 to 6.7 percent.
Below is a line graph. Click here for the text describing this graph.
Figure 2.10 Past Month Marijuana Use among Youths Aged 12 to 17, by Gender: 2002-2011
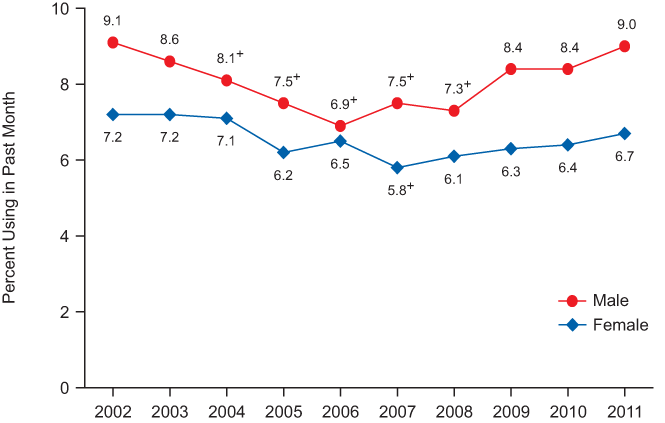
+ Difference between this estimate and the 2011 estimate is statistically significant at the .05 level.
Pregnant Women
- Among pregnant women aged 15 to 44, 5.0 percent were current illicit drug users based on data averaged across 2010 and 2011. This was lower than the rate among women in this age group who were not pregnant (10.8 percent). Among pregnant women aged 15 to 44, the average rate of current illicit drug use in 2010-2011 (5.0 percent) was not significantly different from the rate averaged across 2008-2009 (4.5 percent).
- The rate of current illicit drug use in the combined 2010-2011 data was 20.9 percent among pregnant women aged 15 to 17, 8.2 percent among pregnant women aged 18 to 25, and 2.2 percent among pregnant women aged 26 to 44. None of these rates were significantly different from those in the combined 2008-2009 data (15.8 percent among pregnant women aged 15 to 17, 7.1 percent among pregnant women aged 18 to 25, and 2.3 percent among pregnant women aged 26 to 44).
Race/Ethnicity
- In 2011, among persons aged 12 or older, the rate of current illicit drug use was lowest among Asians (3.8 percent) (Figure 2.11). The rates were 8.4 percent among Hispanics, 8.7 percent among whites, 10.0 percent among blacks, 11.0 percent among Native Hawaiians or Other Pacific Islanders, 13.4 percent among American Indians or Alaska Natives, and 13.5 percent among persons of two or more races.
Below is a line graph. Click here for the text describing this graph.
Figure 2.11 Past Month Illicit Drug Use among Persons Aged 12 or Older, by Race/Ethnicity: 2002-2011
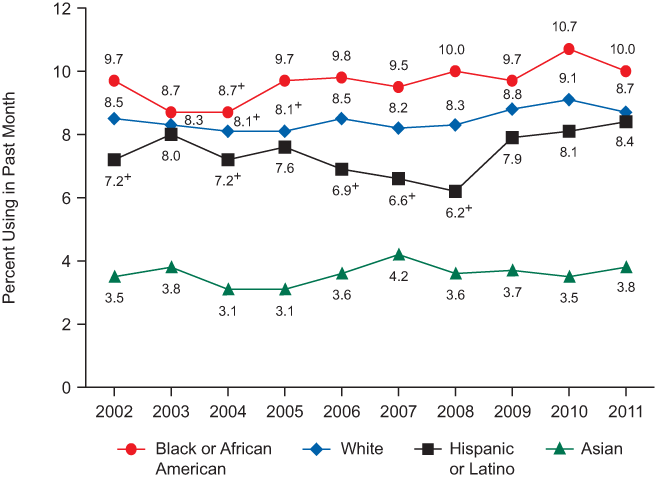
+ Difference between this estimate and the 2011 estimate is statistically significant at the .05 level.
Note: Sample sizes for American Indians or Alaska Natives and for persons of two or more races were too small for reliable trend presentation for these groups. Due to low precision, estimates for Native Hawaiians or Other Pacific Islanders are not shown.
- There were no statistically significant differences in the rates of current illicit drug use between 2010 and 2011 or between 2002 and 2011 for any of the racial/ethnic groups, except for Hispanics. The current illicit drug use rate for Hispanics increased between 2002 and 2011 (from 7.2 to 8.4 percent).
Education
- Illicit drug use in 2011 varied by the educational status of adults aged 18 or older, with the rate of current illicit drug use lower among college graduates (5.4 percent) than those with some college education (10.4 percent), high school graduates (8.9 percent), and those who had not graduated from high school (11.1 percent).
College Students
- In 2011, the rate of current use of illicit drugs was 22.0 percent among full-time college students aged 18 to 22. This was similar to the rate among other persons aged 18 to 22 (23.4 percent), which included part-time college students, students in other grades or types of institutions, and nonstudents.
- In 2011, the rate of current illicit drug use was 25.8 percent among male full-time college students aged 18 to 22, which was higher than the rate among female full-time college students aged 18 to 22 (18.9 percent). Similarly, 23.7 percent of male full-time college students aged 18 to 22 were current marijuana users compared with 17.5 percent of female full-time college students aged 18 to 22.
Employment
- Current illicit drug use differed by employment status in 2011. Among adults aged 18 or older, the rate of current illicit drug use was higher for those who were unemployed (17.2 percent) than for those who were employed full time (8.0 percent), employed part time (11.6 percent), or “other” (6.4 percent) (which includes students, persons keeping house or caring for children full time, retired or disabled persons, or other persons not in the labor force) (Figure 2.12).
Below is a set of two bar graphs. Click here for the text describing these graphs.
Figure 2.12 Past Month Illicit Drug Use among Persons Aged 18 or Older, by Employment Status: 2010 and 2011
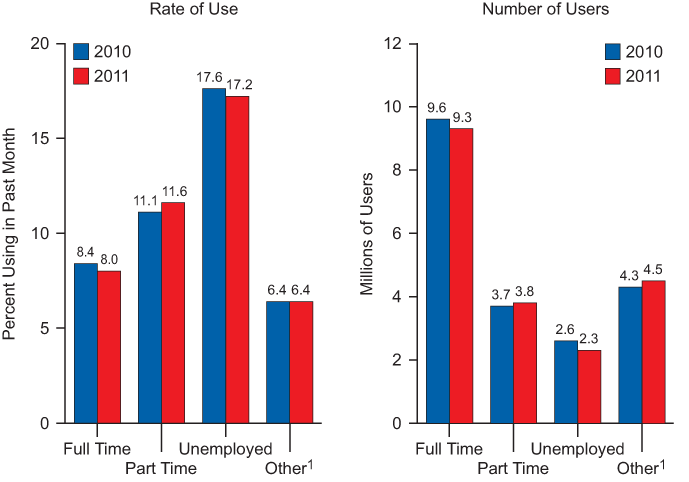
+ Difference between this estimate and the 2011 estimate is statistically significant at the .05 level.
1 The Other Employment category includes students, persons keeping house or caring for children full time, retired or disabled persons, or other persons not in the labor force.
- Although the rate of current illicit drug use was higher among unemployed persons in 2011 compared with those who were either employed full time, employed part time, or “other,” most of these users were employed. Of the 19.9 million current illicit drug users aged 18 or older in 2011, 13.1 million (65.7 percent) were employed either full or part time.
Geographic Area
- Among persons aged 12 or older, the rate of current illicit drug use in 2011 was 10.5 percent in the West, 9.2 percent in the Northeast, 8.5 percent in the Midwest, and 7.5 percent in the South.
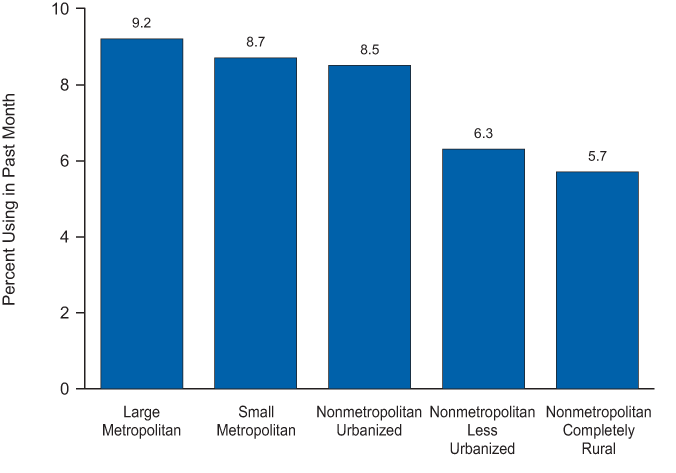
- In 2011, the rate of current illicit drug use among persons aged 12 or older was 9.2 percent in large metropolitan counties, 8.7 percent in small metropolitan counties, and 7.2 percent in nonmetropolitan counties as a group (Figure 2.13). Within nonmetropolitan areas, the rate was 8.5 percent in urbanized counties, 6.3 percent in less urbanized counties, and 5.7 percent in completely rural counties.
Below is a bar graph. Click here for the text describing this graph.
Figure 2.13 Past Month Illicit Drug Use among Persons Aged 12 or Older, by County Type: 2011
Criminal Justice Populations
- In 2011, an estimated 1.7 million adults aged 18 or older were on parole or other supervised release from prison at some time during the past year. More than one quarter of these (26.5 percent) were current illicit drug users, with 20.4 percent reporting current use of marijuana and 9.1 percent reporting current nonmedical use of psychotherapeutic drugs. These rates were higher than those reported by adults aged 18 or older who were not on parole or supervised release during the past year (8.4 percent for illicit drug use, 6.8 percent for marijuana use, and 2.3 percent for nonmedical use of psychotherapeutic drugs).
- In 2011, an estimated 4.7 million adults aged 18 or older were on probation at some time during the past year. More than one quarter (28.5 percent) were current illicit drug users, with 23.6 percent reporting current use of marijuana and 10.1 percent reporting current nonmedical use of psychotherapeutic drugs. These rates were higher than those reported by adults who were not on probation during the past year (8.2 percent for illicit drug use, 6.6 percent for marijuana use, and 2.2 percent for nonmedical use of psychotherapeutic drugs).
Frequency of Marijuana Use
- In 2011, an estimated 16.7 percent of past year marijuana users aged 12 or older used marijuana on 300 or more days within the past 12 months. This translates into nearly 5.0 million persons using marijuana on a daily or almost daily basis over a 12-month period.
- In 2011, an estimated 39.1 percent (7.1 million) of current marijuana users aged 12 or older used marijuana on 20 or more days in the past month. This was similar to the 2010 estimate of 39.8 percent or 6.9 million users.
Association with Cigarette and Alcohol Use
- In 2011, the rate of current illicit drug use was approximately 9.5 times higher among youths aged 12 to 17 who smoked cigarettes in the past month (57.6 percent) than it was among those who did not smoke cigarettes in the past month (6.1 percent). Moreover, the 2011 rate of current illicit drug use among youths aged 12 to 17 who smoked cigarettes in the past month was an increase from the 2010 estimate of 52.7 percent.
- In 2011, the rate of current illicit drug use was associated with the level of past month alcohol use. Among youths aged 12 to 17 who were heavy drinkers (i.e., consumed five or more drinks on the same occasion on each of 5 or more days in the past 30 days), 70.4 percent were current illicit drug users, which was higher than the rate among those who were not current alcohol users (5.3 percent). Additionally, among youths aged 12 to 17 who were binge but not heavy drinkers (i.e., consumed five or more drinks on the same occasion on 1 to 4 days in the past 30 days), 44.7 percent were also current illicit drug users.
- In 2011, the rate of current illicit drug use was approximately 17 times higher among youths aged 12 to 17 who both smoked cigarettes and drank alcohol in the past month (68.7 percent) than it was among those who neither smoked cigarettes nor drank alcohol in the past month (4.0 percent).
Driving Under the Influence of Illicit Drugs
- In 2011, 9.4 million persons or 3.7 percent of the population aged 12 or older reported driving under the influence of illicit drugs during the past year. This was a decrease from the rate in 2010 (4.2 percent) and the rate in 2002 (4.7 percent). Across age groups, the rate of driving under the influence of illicit drugs in 2011 was highest among young adults aged 18 to 25 (11.6 percent); this rate for young adults in 2011 was lower than the rate in 2010 (12.7 percent). Additionally, the rate of driving under the influence of illicit drugs during the past year decreased among adults aged 26 or older (from 2.9 percent in 2010 to 2.4 percent in 2011).
Source of Prescription Drugs
- Past year nonmedical users of psychotherapeutic drugs are asked how they obtained the drugs they most recently used nonmedically. Rates averaged across 2010 and 2011 show that over one half of the nonmedical users of pain relievers, tranquilizers, stimulants, and sedatives aged 12 or older got the prescription drugs they most recently used “from a friend of relative for free.” About 4 in 5 of these nonmedical users who obtained prescription drugs from a friend or relative for free indicated that their friend or relative had obtained the drugs from one doctor.
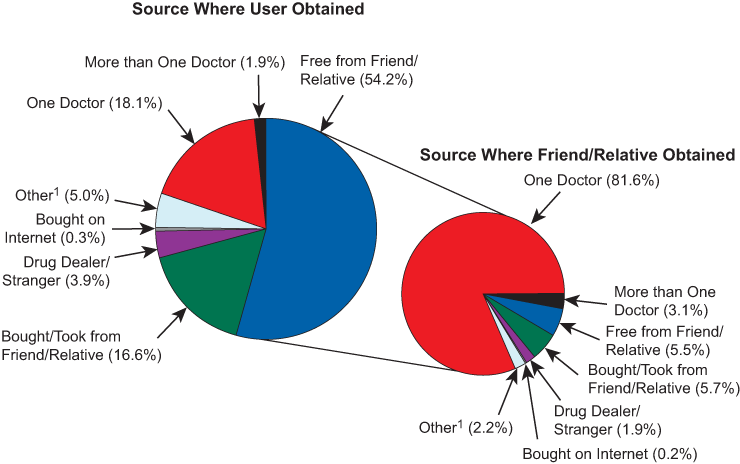
- Among persons aged 12 or older in 2010-2011 who used pain relievers nonmedically in the past year, 54.2 percent got the pain relievers they most recently used from a friend or relative for free (Figure 2.14). Another 12.2 percent bought them from a friend of relative (which was higher than the 9.9 percent in 2008-2009). In addition, 4.4 percent of these nonmedical users in 2010-2011 took pain relievers from a friend or relative without asking. More than one in six (18.1 percent) indicated that they got the drugs they most recently used through a prescription from one doctor. Less than 1 in 20 users (3.9 percent) got pain relievers from a drug dealer or other stranger, 1.9 percent got pain relievers from more than one doctor, and 0.3 percent bought them on the Internet. These other percentages were similar to those reported in 2008-2009.
Below is a set of two pie graphs. Click here for the text describing these graphs.
Figure 2.14 Source Where Pain Relievers Were Obtained for Most Recent Nonmedical Use among Past Year Users Aged 12 or Older: 2010-2011
Note: The percentages do not add to 100 percent due to rounding.
1 The Other category includes the sources “Wrote Fake Prescription,” “Stole from Doctor’s Office/Clinic/Hospital/Pharmacy,” and “Some Other Way.”
- Among persons aged 12 or older in 2010-2011 who used pain relievers nonmedically in the past year and indicated that they most recently obtained the drugs from a friend or relative for free in the past year, 81.6 percent of the friends or relatives obtained the drugs from just one doctor (Figure 2.14). About 1 in 20 of these past year nonmedical users of pain relievers (5.5 percent) reported that the friend or relative got the pain relievers from another friend or relative for free, 3.9 percent reported that the friend or relative bought the drugs from a friend or relative, 1.9 percent reported that the friend or relative bought the drugs from a drug dealer or other stranger, and 1.8 percent reported that the friend or relative took the drugs from another friend or relative without asking.
Next: Alcohol Use