Reprinted with permission of the Substance Abuse and Mental Health Services Administration www.SAMHSA.gov
U.S. DEPARTMENT OF HEALTH AND HUMAN SERVICES
Substance Abuse and Mental Health Services Administration
Center for Behavioral Health Statistics and Quality
7. Substance Dependence, Abuse, and Treatment
The National Survey on Drug Use and Health (NSDUH) includes a series of questions to assess the prevalence of substance use disorders (substance dependence or abuse) in the past 12 months. Substances include alcohol and illicit drugs, such as marijuana, cocaine, heroin, hallucinogens, inhalants, and the nonmedical use of prescription-type psychotherapeutic drugs. These questions are used to classify persons as dependent on or abusing specific substances based on criteria specified in the Diagnostic and Statistical Manual of Mental Disorders, 4th edition (DSM-IV) (American Psychiatric Association [APA], 1994).
The questions related to dependence ask about health and emotional problems associated with substance use, unsuccessful attempts to cut down on use, tolerance, withdrawal, reducing other activities to use substances, spending a lot of time engaging in activities related to substance use, or using the substance in greater quantities or for a longer time than intended. The questions on abuse ask about problems at work, home, and school; problems with family or friends; physical danger; and trouble with the law due to substance use. Dependence is considered to be a more severe substance use problem than abuse because it involves the psychological and physiological effects of tolerance and withdrawal.
This chapter provides estimates of the prevalence and patterns of substance use disorders occurring in the past year from the 2011 NSDUH and compares these estimates against the results from the 2002 through 2010 surveys. It also provides estimates of the prevalence and patterns of the receipt of treatment in the past year for problems related to substance use. This chapter concludes with a discussion of the need for and the receipt of treatment at specialty facilities for problems associated with substance use.
7.1. Substance Dependence or Abuse
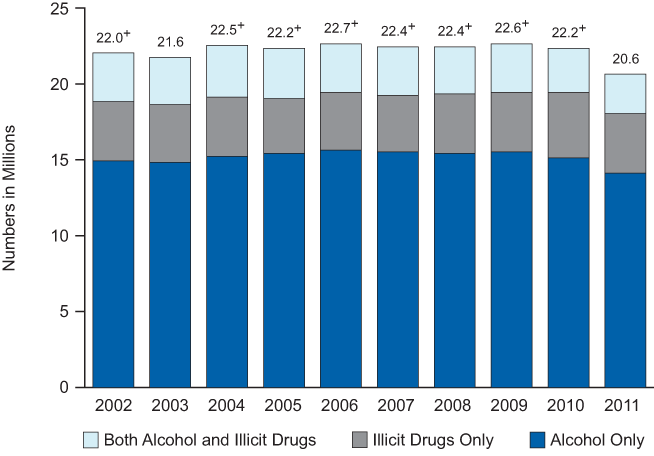
- In 2011, an estimated 20.6 million persons aged 12 or older were classified with substance dependence or abuse in the past year (8.0 percent of the population aged 12 or older) (Figure 7.1). Of these, 2.6 million were classified with dependence or abuse of both alcohol and illicit drugs, 3.9 million had dependence or abuse of illicit drugs but not alcohol, and 14.1 million had dependence or abuse of alcohol but not illicit drugs.
Below is a stacked bar graph. Click here for the text describing this graph.
Figure 7.1 Substance Dependence or Abuse in the Past Year among Persons Aged 12 or Older: 2002-2011
+ Difference between this estimate and the 2011 estimate is statistically significant at the .05 level.
- The annual number of persons with substance dependence or abuse remained stable between 2002 and 2010, ranging from 21.6 million to 22.7 million. However, the number in 2011 (20.6 million) was lower than the number in 2010 (22.2 million).
- In 2011, 16.7 million persons aged 12 or older were classified with alcohol dependence or abuse, which was lower than the number in 2010 (18.0 million) and in each year from 2002 to 2009 (18.1 million in 2002, 17.8 million in 2003, 18.7 million in 2004, 18.7 million in 2005, 18.9 million in 2006, 18.7 million in 2007, 18.5 million in 2008, and 18.8 million in 2009).
- In 2011, 6.5 percent of the population aged 12 or older had alcohol dependence or abuse, which was lower than the rate in each year since 2002 (7.7 percent in 2002, 7.5 percent in 2003, 7.8 percent in 2004, 7.7 percent in 2005, 7.7 percent in 2006, 7.5 percent in 2007, 7.4 percent in 2008, 7.5 percent in 2009, and 7.1 percent in 2010).
- The number of persons aged 12 or older who had illicit drug dependence or abuse was similar between 2010 (7.1 million) and 2011 (6.5 million) and between 2002 (7.1 million) and 2011. However, the rate of persons aged 12 or older who had illicit drug dependence or abuse in 2011 (2.5 percent) was lower than the rate in 2010 (2.8 percent) and in most years from 2002 to 2009. The rate of illicit drug dependence or abuse in 2002 to 2009 ranged from 2.8 to 3.0 percent.
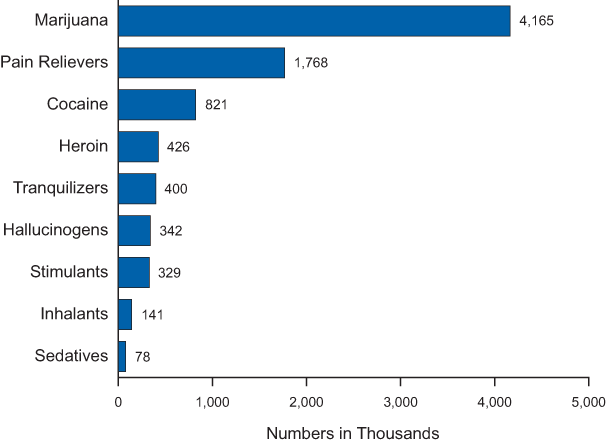
- Marijuana was the illicit drug with the highest rate of past year dependence or abuse in 2011, followed by pain relievers and cocaine. Of the 6.5 million persons aged 12 or older classified with illicit drug dependence or abuse in 2011, 4.2 million had marijuana dependence or abuse (representing 1.6 percent of the total population aged 12 or older, and 63.8 percent of all those classified with illicit drug dependence or abuse), 1.8 million persons had pain reliever dependence or abuse, and 821,000 persons had cocaine dependence or abuse (Figure 7.2).
Below is a bar graph. Click here for the text describing this graph.
Figure 7.2 Specific Illicit Drug Dependence or Abuse in the Past Year among Persons Aged 12 or Older: 2011
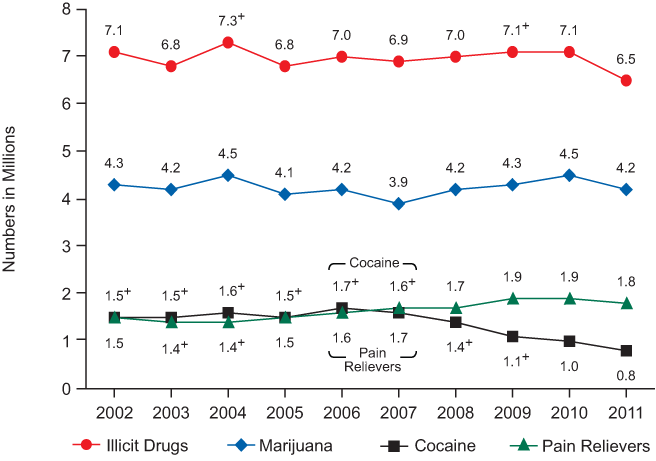
- The number of persons who had marijuana dependence or abuse did not change significantly between 2002 (4.3 million) and 2011 (4.2 million) or between 2010 (4.5 million) and 2011 (Figure 7.3). The rate of persons who had marijuana dependence or abuse in 2011 (1.6 percent) was lower than the rates in 2002 (1.8 percent) and 2004 (1.9 percent), but was similar to the rate in 2010 (1.8 percent).
Below is a line graph. Click here for the text describing this graph.
Figure 7.3 Illicit Drug Dependence or Abuse in the Past Year among Persons Aged 12 or Older: 2002-2011
+ Difference between this estimate and the 2011 estimate is statistically significant at the .05 level.
- The rate and the number of persons who had pain reliever dependence or abuse remained unchanged between 2010 (0.8 percent and 1.9 million) and 2011 (0.7 percent and 1.8 million) and between 2002 (0.6 percent and 1.5 million) and 2011. However, the number with pain reliever dependence or abuse was higher in 2011 than in 2004 (1.4 million).
- The rate and the number of persons who had cocaine dependence or abuse were similar between 2010 (0.4 percent and 1.0 million) and 2011 (0.3 percent and 821,000). However, they decreased between 2006 (0.7 percent and 1.7 million) and 2011.
- The rate and the number of persons who had heroin dependence or abuse were stable between 2010 (0.1 percent and 361,000) and 2011 (0.2 percent and 426,000). However, they increased between 2007 (0.1 percent and 214,000) and 2011.
Age at First Use
- In 2011, among adults aged 18 or older, age at first use of marijuana was associated with illicit drug dependence or abuse. Among those who first tried marijuana at age 14 or younger, 12.7 percent were classified with illicit drug dependence or abuse, which was higher than the 2.0 percent of adults who had first used marijuana at age 18 or older.
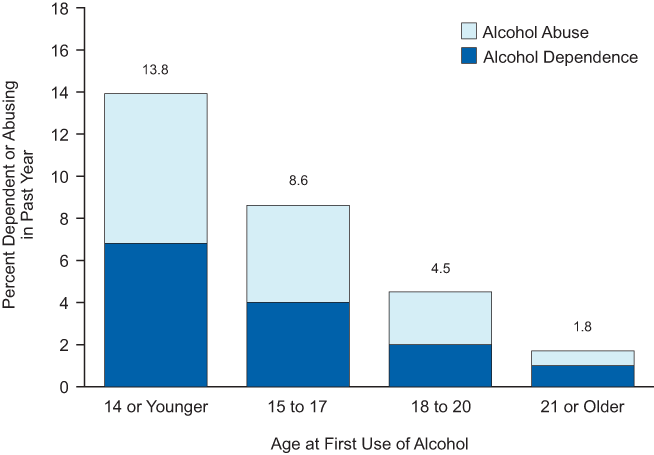
- Among adults, age at first use of alcohol was associated with alcohol dependence or abuse. In 2011, among adults aged 18 or older who first tried alcohol at age 14 or younger, 14.8 percent were classified with alcohol dependence or abuse, which was higher than the 3.5 percent of adults who had first used alcohol at age 18 or older. Adults aged 21 or older who had first used alcohol before age 21 were more likely than adults who had their first drink at age 21 or older to be classified with alcohol dependence or abuse (Figure 7.4). In particular, adults aged 21 or older who had first used alcohol at age 14 or younger were more than 7 times as likely to be classified with alcohol dependence or abuse than adults who had their first drink at age 21 or older (13.8 vs. 1.8 percent). The rate of adults aged 21 or older who first used alcohol at age 21 or older and were classified with alcohol dependence or abuse in 2011 was lower than the rate in 2010 (2.7 percent).
Below is a stacked bar graph. Click here for the text describing this graph.
Figure 7.4 Alcohol Dependence or Abuse in the Past Year among Adults Aged 21 or Older, by Age at First Use of Alcohol: 2011
Age
- Rates of substance dependence or abuse were associated with age. In 2011, the rate of substance dependence or abuse among adults aged 18 to 25 (18.6 percent) was higher than that among youths aged 12 to 17 (6.9 percent) and among adults aged 26 or older (6.3 percent). Both the rate among adults aged 18 to 25 and the rate among adults aged 26 or older declined between 2010 (20.0 and 7.0 percent, respectively) and 2011. From 2002 to 2011, the rate decreased for youths aged 12 to 17 (from 8.9 to 6.9 percent), for young adults aged 18 to 25 (from 21.7 to 18.6 percent), and for adults aged 26 or older (from 7.3 to 6.3 percent).
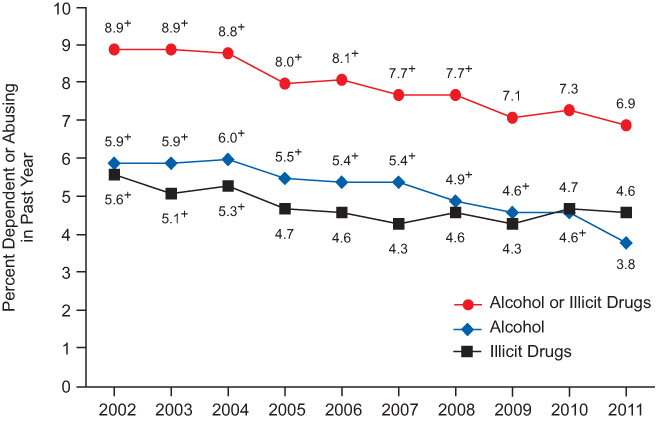
- The rate of alcohol dependence or abuse among youths aged 12 to 17 was 3.8 percent in 2011, which declined from 4.6 percent in 2010 and from 5.9 percent in 2002 (Figure 7.5). Among young adults aged 18 to 25, the rate of alcohol dependence or abuse also decreased between 2010 (15.7 percent) and 2011 (14.4 percent) and between 2002 (17.7 percent) and 2011. Among adults aged 26 or older, the rate was stable between 2010 (5.9 percent) and 2011 (5.4 percent), but it decreased between 2002 (6.2 percent) and 2011.
Below is a line graph. Click here for the text describing this graph.
Figure 7.5 Alcohol and Illicit Drug Dependence or Abuse among Youths Aged 12 to 17: 2002-2011
+ Difference between this estimate and the 2011 estimate is statistically significant at the .05 level.
Gender
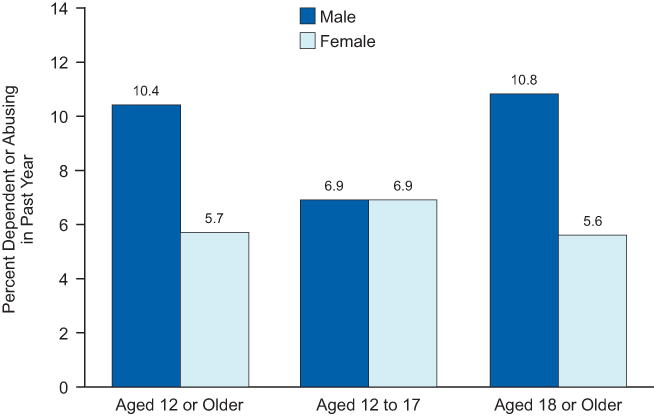
- As was the case from 2002 through 2010, the rate of substance dependence or abuse for males aged 12 or older in 2011 was about twice as high as the rate for females. For males in 2011, the rate was 10.4 percent, which decreased from 11.7 percent in 2010 (Figure 7.6). For females, it was 5.7 percent in 2011, which did not differ from the rate of 6.0 percent in 2010. Among youths aged 12 to 17, the rate of substance dependence or abuse among males was not different from the rate among females in 2011 (6.9 percent for each).
Below is a bar graph. Click here for the text describing this graph.
Figure 7.6 Substance Dependence or Abuse in the Past Year, by Age and Gender: 2011
Race/Ethnicity
- In 2011, among persons aged 12 or older, the rate of substance dependence or abuse was lower among Asians (3.3 percent) than among other racial/ethnic groups. The rates for the other racial/ethnic groups were 16.8 percent for American Indians or Alaska Natives, 10.6 percent for Native Hawaiians or Other Pacific Islanders, 9.0 percent for persons reporting two or more races, 8.7 percent for Hispanics, 8.2 percent for whites, and 7.2 percent for blacks.
Education
- Rates of substance dependence or abuse were associated with level of education in 2011. Among adults aged 18 or older, those who graduated from a college or university had a lower rate of substance dependence or abuse (6.4 percent) than those who graduated from high school (8.0 percent), those who did not graduate from high school (9.3 percent), and those with some college (9.5 percent).
Employment
- Rates of substance dependence or abuse were associated with current employment status in 2011. A higher percentage of unemployed adults aged 18 or older were classified with dependence or abuse (14.8 percent) than were full-time employed adults (8.4 percent) or part-time employed adults (9.8 percent).
- About half of the adults aged 18 or older with substance dependence or abuse were employed full time in 2011. Of the 18.9 million adults classified with dependence or abuse, 9.8 million (51.8 percent) were employed full time.
Criminal Justice Populations
- In 2011, adults aged 18 or older who were on parole or a supervised release from jail during the past year had higher rates of illicit drug or alcohol dependence or abuse (35.1 percent) than their counterparts who were not on parole or supervised release during the past year (7.9 percent).
- In 2011, probation status was associated with substance dependence or abuse. The rate of substance dependence or abuse was 33.7 percent among adults who were on probation during the past year, which was higher than the rate among adults who were not on probation during the past year (7.6 percent).
Geographic Area
- In 2011, rates of substance dependence or abuse for persons aged 12 or older were 8.9 percent in the West, 8.6 percent in the Northeast, 8.3 percent in the Midwest, and 7.0 percent in the South.
- Rates for substance dependence or abuse among persons aged 12 or older in 2011 were similar in large metropolitan counties (8.4 percent) and small metropolitan counties (8.2 percent), but were higher than in nonmetropolitan counties (6.3 percent).
7.2. Past Year Treatment for a Substance Use Problem
Estimates described in this section refer to treatment received for illicit drug or alcohol use, or for medical problems associated with the use of illicit drugs or alcohol. This includes treatment received in the past year at any location, such as a hospital (inpatient), rehabilitation facility (outpatient or inpatient), mental health center, emergency room, private doctor’s office, prison or jail, or a self-help group, such as Alcoholics Anonymous or Narcotics Anonymous. Persons could report receiving treatment at more than one location. Note that the definition of treatment in this section is different from the definition of specialty treatment described in Section 7.3. Specialty treatment includes treatment only at a hospital (inpatient), a rehabilitation facility (inpatient or outpatient), or a mental health center.
Individuals who reported receiving substance use treatment but were missing information on whether the treatment was specifically for alcohol use or illicit drug use were not counted in estimates of either illicit drug use treatment or alcohol use treatment; however, they were counted in estimates for “drug or alcohol use” treatment.
- In 2011, 3.8 million persons aged 12 or older (1.5 percent of the population) received treatment for a problem related to the use of alcohol or illicit drugs. Of these, 1.2 million received treatment for the use of both alcohol and illicit drugs, 0.8 million received treatment for the use of illicit drugs but not alcohol, and 1.4 million received treatment for the use of alcohol but not illicit drugs. (Note that estimates by substance do not sum to the total number of persons receiving treatment because the total includes persons who reported receiving treatment but did not report for which substance the treatment was received.)
- The rate and the number of persons in the population aged 12 or older receiving substance use treatment within the past year was stable between 2010 (1.6 percent and 4.2 million) and 2011 (1.5 percent and 3.8 million) and between 2002 (1.5 percent and 3.5 million) and 2011.
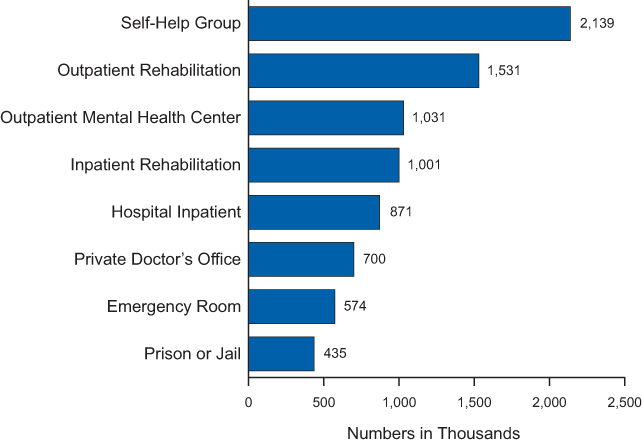
- In 2011, among the 3.8 million persons aged 12 or older who received treatment for alcohol or illicit drug use in the past year, 2.1 million persons received treatment at a self-help group, and 1.5 million received treatment at a rehabilitation facility as an outpatient (Figure 7.7). There were 1.0 million persons who received treatment at a mental health center as an outpatient, 1.0 million persons who received treatment at a rehabilitation facility as an inpatient, 871,000 at a hospital as an inpatient, 700,000 at a private doctor’s office, 574,000 at an emergency room, and 435,000 at a prison or jail. None of these estimates changed significantly between 2010 and 2011. Except for persons who received treatment at a prison or jail, these estimates also did not change between 2002 and 2011; the number of persons who received treatment at a prison or jail increased from 259,000 in 2002 to 435,000 in 2011.
Below is a bar graph. Click here for the text describing this graph.
Figure 7.7 Locations Where Past Year Substance Use Treatment Was Received among Persons Aged 12 or Older: 2011
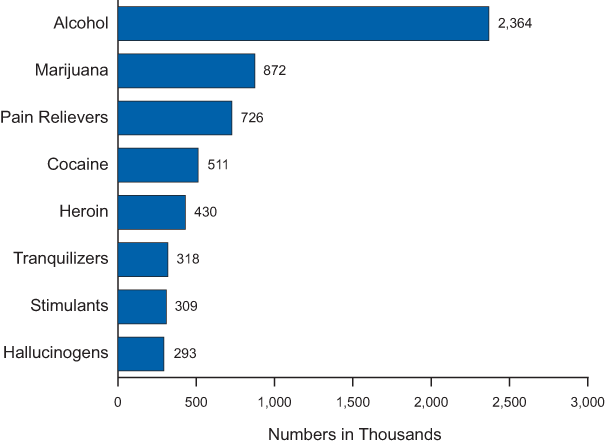
- In 2011, during their most recent treatment in the past year, 2.4 million persons aged 12 or older reported receiving treatment for alcohol use, and 872,000 persons reported receiving treatment for marijuana use (Figure 7.8). Estimates for receiving treatment for the use of other drugs were 726,000 persons for pain relievers, 511,000 for cocaine, 430,000 for heroin, 318,000 for tranquilizers, 309,000 for stimulants, and 293,000 for hallucinogens. None of these estimates changed significantly between 2010 and 2011.
Below is a bar graph. Click here for the text describing this graph.
Figure 7.8 Substances for Which Most Recent Treatment Was Received in the Past Year among Persons Aged 12 or Older: 2011
- The numbers of persons aged 12 or older who received treatment for the use of pain relievers (see Figure 7.9) and tranquilizers increased between 2002 and 2011. Numbers who received treatment for pain relievers in 2009 to 2011 ranged from 726,000 to 761,000 persons and were greater than the numbers in 2002 to 2005.
Below is a bar graph. Click here for the text describing this graph.
Figure 7.9 Received Most Recent Treatment in the Past Year for the Use of Pain Relievers among Persons Aged 12 or Older: 2002-2011
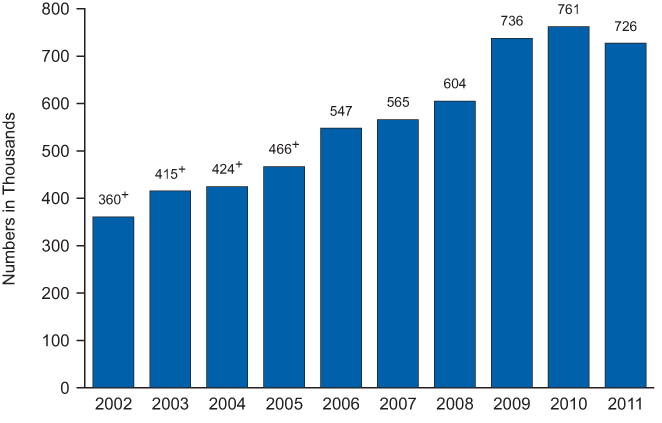
+ Difference between this estimate and the 2011 estimate is statistically significant at the .05 level.
- The numbers of persons aged 12 or older who received treatment for marijuana, hallucinogens, and stimulants were stable between 2002 and 2011. (Note that respondents could indicate that they received treatment for more than one substance during their most recent treatment.)
7.3. Need for and Receipt of Specialty Treatment
This section discusses the need for and receipt of treatment for a substance use problem at a “specialty” treatment facility. Specialty treatment is defined as treatment received at any of the following types of facilities: hospitals (inpatient only), drug or alcohol rehabilitation facilities (inpatient or outpatient), or mental health centers. It does not include treatment at an emergency room, private doctor’s office, self-help group, prison or jail, or hospital as an outpatient. An individual is defined as needing treatment for an alcohol or drug use problem if he or she met the DSM-IV (APA, 1994) diagnostic criteria for alcohol or illicit drug dependence or abuse in the past 12 months or if he or she received specialty treatment for alcohol use or illicit drug use in the past 12 months.
In this section, an individual needing treatment for an illicit drug use problem is defined as receiving treatment for his or her drug use problem only if he or she reported receiving specialty treatment for illicit drug use in the past year. Thus, an individual who needed treatment for illicit drug use but received specialty treatment only for alcohol use in the past year or who received treatment for illicit drug use only at a facility not classified as a specialty facility was not counted as receiving treatment for illicit drug use. Similarly, an individual who needed treatment for an alcohol use problem was counted as receiving alcohol use treatment only if the treatment was received for alcohol use at a specialty treatment facility. Individuals who reported receiving specialty substance use treatment but were missing information on whether the treatment was specifically for alcohol use or drug use were not counted in estimates of specialty drug use treatment or in estimates of specialty alcohol use treatment; however, they were counted in estimates for “drug or alcohol use” treatment.
In addition to questions about symptoms of substance use problems that are used to classify respondents’ need for treatment based on DSM-IV criteria, NSDUH includes questions asking respondents about their perceived need for treatment (i.e., whether they felt they needed treatment or counseling for illicit drug use or alcohol use). In this report, estimates for perceived need for treatment are discussed only for persons who were classified as needing treatment (based on DSM-IV criteria) but did not receive treatment at a specialty facility. Similarly, estimates for whether a person made an effort to get treatment are discussed only for persons who felt the need for treatment and did not receive it.
Illicit Drug or Alcohol Use Treatment and Treatment Need
- In 2011, 21.6 million persons aged 12 or older needed treatment for an illicit drug or alcohol use problem (8.4 percent of persons aged 12 or older). Both the rate and the number declined between 2010 (9.2 percent and 23.2 million) and 2011 and between 2002 (9.7 percent and 22.8 million) and 2011. In 2011, 2.3 million persons (0.9 percent of persons aged 12 or older and 10.8 percent of those who needed treatment) received treatment at a specialty facility, which did not differ from the rates and numbers in 2010 and 2002.
- In 2011, 19.3 million persons (7.5 percent of the population aged 12 or older) needed treatment for an illicit drug or alcohol use problem but did not receive treatment at a specialty facility in the past year. Both the rate and the number declined between 2010 (8.1 percent and 20.6 million) and 2011 and between 2002 (8.7 percent and 20.5 million) and 2011.
- Of the 2.3 million persons aged 12 or older who received specialty substance use treatment in 2011, 898,000 received treatment for alcohol use only, 780,000 received treatment for illicit drug use only, and 574,000 received treatment for both alcohol and illicit drug use. These estimates were similar to the estimates for 2010 and 2002.
- Among persons in 2011 who received their most recent substance use treatment at a specialty facility in the past year, 46.4 percent reported using their “own savings or earnings” as a source of payment for their most recent specialty treatment, 38.5 percent reported using private health insurance, 35.0 percent reported using Medicaid, 31.2 percent reported using Medicare, 31.0 percent reported using public assistance other than Medicaid, and 26.0 percent reported using funds from family members. None of these estimates changed significantly between 2010 and 2011. However, there were increases in persons reporting using Medicaid or using Medicare between 2002 (23.1 and 19.5 percent, respectively) and 2011.
- Of the 19.3 million persons aged 12 or older in 2011 who were classified as needing substance use treatment but not receiving treatment at a specialty facility in the past year, 912,000 persons (4.7 percent) reported that they perceived a need for treatment for their illicit drug or alcohol use problem (Figure 7.10). Of these 912,000 persons who felt they needed treatment but did not receive treatment in 2011, 281,000 (30.8 percent) reported that they made an effort to get treatment, and 631,000 (69.2 percent) reported making no effort to get treatment. These estimates were stable between 2010 and 2011.
Below is a pie graph. Click here for the text describing this graph.
Figure 7.10 Past Year Perceived Need for and Effort Made to Receive Specialty Treatment among Persons Aged 12 or Older Needing But Not Receiving Treatment for Illicit Drug or Alcohol Use: 2011
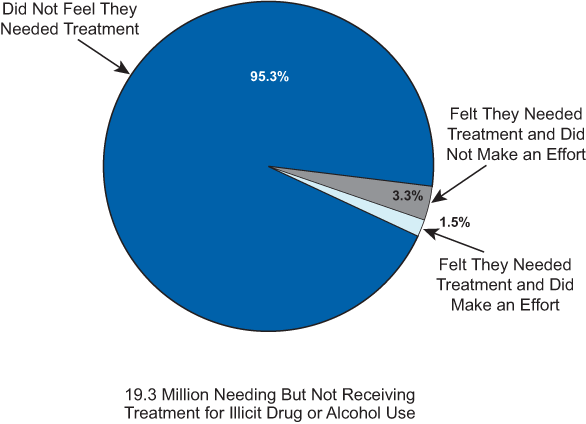
Note: The percentages do not add to 100 percent due to rounding.
- The rate and the number of youths aged 12 to 17 who needed treatment for an illicit drug or alcohol use problem in 2011 (7.0 percent and 1.7 million) were similar to those in 2010 (7.5 percent and 1.8 million), but they were lower than those in 2002 (9.1 percent and 2.3 million). Of the 1.7 million youths who needed treatment in 2011, 146,000 received treatment at a specialty facility (about 8.4 percent of the youths who needed treatment), leaving about 1.6 million who needed treatment for a substance use problem but did not receive it at a specialty facility.
- Based on 2008-2011 combined data, the six most often reported reasons for not receiving illicit drug or alcohol use treatment among persons aged 12 or older who needed and perceived a need for treatment but did not receive treatment at a specialty facility were (a) not ready to stop using (39.2 percent), (b) no health coverage and could not afford cost (32.3 percent), (c) possible negative effect on job (13.9 percent), (d) concern that receiving treatment might cause neighbors/community to have negative opinion (12.3 percent), (e) not knowing where to go for treatment (9.9 percent), and (f) could handle the problem without treatment (8.8 percent).
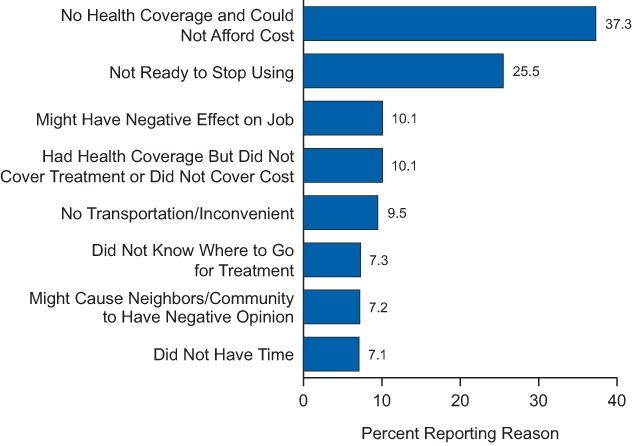
- Based on 2008-2011 combined data, among persons aged 12 or older who needed but did not receive illicit drug or alcohol use treatment, felt a need for treatment, and made an effort to receive treatment, the most often reported reasons for not receiving treatment were (a) no health coverage and could not afford cost (37.3 percent), (b) not ready to stop using (25.5 percent), (c) might have negative effect on job (10.1 percent), (d) had health coverage but did not cover treatment or did not cover cost (10.1 percent), (e) no transportation or inconvenient (9.5 percent), (f) did not know where to go for treatment (7.3 percent), (g) might cause neighbors/community to have negative opinion (7.2 percent), and (h) did not have time for treatment (7.1 percent) (Figure 7.11).
Below is a bar graph. Click here for the text describing this graph.
Figure 7.11 Reasons for Not Receiving Substance Use Treatment among Persons Aged 12 or Older Who Needed and Made an Effort to Get Treatment But Did Not Receive Treatment and Felt They Needed Treatment: 2008-2011 Combined
Illicit Drug Use Treatment and Treatment Need
- In 2011, the number of persons aged 12 or older needing treatment for an illicit drug use problem was 7.2 million (2.8 percent of the total population). Both the rate and the number declined between 2010 (3.1 percent and 7.9 million) and 2011. Although the percentage of persons needing treatment for an illicit drug use problem declined between 2002 (3.3 percent) and 2011, the corresponding number of persons did not differ between 2002 (7.7 million) and 2011.
- Of the 7.2 million persons aged 12 or older who needed treatment for an illicit drug use problem in 2011, 1.4 million (0.5 percent of the total population and 18.8 percent of persons who needed treatment) received treatment at a specialty facility for an illicit drug use problem in the past year. The rate and the number were similar between 2010 and 2011 and between 2002 and 2011.
- There were 5.8 million persons (2.3 percent of the total population) who needed but did not receive treatment at a specialty facility for an illicit drug use problem in 2011, which declined between 2010 (6.4 million and 2.5 percent) and 2011. The rate declined between 2002 (2.7 percent) and 2011, but the numbers in 2002 (6.3 million) and 2011 were similar.
- Of the 5.8 million people aged 12 or older who needed but did not receive specialty treatment for illicit drug use in 2011, 488,000 (8.4 percent) reported that they perceived a need for treatment for their illicit drug use problem, and 5.3 million did not perceive a need for treatment. The number of persons who needed treatment for an illicit drug use problem but did not perceive the need declined between 2010 (6.0 million) and 2011 (5.3 million).
- Of the 488,000 persons who felt a need for treatment in 2011, 187,000 reported that they made an effort to get treatment, and 301,000 reported making no effort to get treatment. These estimates were similar to the estimates in 2010.
- Among youths aged 12 to 17, there were 1.2 million persons (4.7 percent) who needed treatment for an illicit drug use problem in 2011. Of this group, only 125,000 received treatment at a specialty facility (10.5 percent of youths aged 12 to 17 who needed treatment), leaving 1.1 million youths who needed treatment but did not receive it at a specialty facility.
- Among people aged 12 or older who needed but did not receive illicit drug use treatment and felt they needed treatment (based on 2008-2011 combined data), the most often reported reasons for not receiving treatment were (a) no health coverage and could not afford cost (43.6 percent), (b) not ready to stop using (29.0 percent), (c) concern that receiving treatment might cause neighbors/community to have negative opinion (14.6 percent), (d) possible negative effect on job (14.1 percent), (e) not knowing where to go for treatment (14.0 percent), and (f) having health coverage that did not cover treatment (10.6 percent).
Alcohol Use Treatment and Treatment Need
- In 2011, the number of persons aged 12 or older needing treatment for an alcohol use problem was 17.4 million (6.8 percent of the population aged 12 or older). Both the number and the rate declined between 2010 (18.6 million and 7.3 percent) and 2011 and between 2002 (18.6 million and 7.9 percent) and 2011.
- Among the 17.4 million persons aged 12 or older who needed treatment for an alcohol use problem in 2011, 1.5 million (0.6 percent of the total population and 8.5 percent of the people who needed treatment for an alcohol use problem) received alcohol use treatment at a specialty facility. These estimates of the need and receipt of treatment for an alcohol use problem did not change significantly between 2010 and 2011 or between 2002 and 2011. However, the number and the rate of persons aged 12 or older who needed but did not receive treatment at a specialty facility for an alcohol use problem declined between 2010 (17.0 million and 6.7 percent) and 2011 (16.0 million and 6.2 percent) and between 2002 (17.1 million and 7.3 percent) and 2011.
- Among the 16.0 million people aged 12 or older who needed but did not receive specialty treatment for an alcohol use problem in 2011, there were 505,000 persons (3.2 percent) who felt they needed treatment for their alcohol use problem. The number and the rate were similar to those reported in 2010 (706,000 persons and 4.1 percent), but were lower than those reported in 2002 (761,000 persons and 4.5 percent). Of the 505,000 persons in 2011 who perceived a need for treatment for an alcohol use problem but did not receive specialty treatment, 368,000 did not make an effort to get treatment, and 137,000 made an effort but were unable to get treatment in 2011.
- In 2011, there were 978,000 youths aged 12 to 17 (3.9 percent) who needed treatment for an alcohol use problem. Of this group, only 63,000 received treatment at a specialty facility (0.3 percent of all youths and 6.4 percent of youths who needed treatment), leaving about 915,000 youths (3.7 percent) who needed but did not receive treatment.
Next: Discussion of Trends in Marijuana, Prescription Drug, Heroin, and Other Substance Use among Youths and Young Adults