A newer version of the platform is available. Please refresh the page.
Sign Up to Get information about Sales & Events Click Here

A newer version of the platform is available. Please refresh the page.
Reprinted with permission of the Substance Abuse and Mental Health Services Administration www.SAMHSA.gov
U.S. DEPARTMENT OF HEALTH AND HUMAN SERVICES
Substance Abuse and Mental Health Services Administration
Center for Behavioral Health Statistics and Quality
Table of Contents
8. Discussion of Trends in Marijuana, Prescription Drug, Heroin, and Other Substance Use among Youths and Young Adults
Description of NSDUH and Other Data Sources
Comparison of NSDUH, MTF, and YRBS Trends
Nonmedical Use of Prescription Pain Relievers
Heroin Use
Previous chapters in this report presented findings from the 2011 National Survey on Drug Use and Health (NSDUH) that describe trends and demographic differences for the incidence and prevalence of use for a variety of substances. This chapter expands upon previous chapters by discussing, in more depth, topics that have been of particular interest in recent years. That is, a comparison of NSDUH trend results with results from other surveys of youth and young adult substance use is presented. Recent trends in the misuse of prescription pain relievers and in the use of heroin, based on NSDUH and other data sources, are discussed.
Description of NSDUH and Other Data Sources
Conducted since 1971 and previously named the National Household Survey on Drug Abuse (NHSDA), the survey underwent several methodological improvements in 2002 that have affected prevalence estimates. As a result, the 2002 through 2011 estimates are not comparable with estimates from 2001 and earlier surveys. Therefore, the primary focus of this report is on comparisons of measures of substance use across subgroups of the U.S. population in 2011, changes between 2010 and 2011, and changes between 2002 and 2011. An important step in the analysis and interpretation of NSDUH or any other survey data is to compare the results with those from other data sources. This can be difficult because the other surveys typically have different purposes, definitions, and designs. Research has established that surveys of substance use and other sensitive topics often produce inconsistent results because of different methods used. Thus, it is important to understand that conflicting results often reflect differing methodologies, not incorrect results. Despite this limitation, comparisons can be very useful. Consistency across surveys can confirm or support conclusions about trends and patterns of use, and inconsistent results can point to areas for further study. Further discussion of this issue is included in Appendix C, along with descriptions of methods and results from other sources of substance use data.
Unfortunately, few additional data sources are available to compare with NSDUH results. One established source is Monitoring the Future (MTF), a study sponsored by the National Institute on Drug Abuse (NIDA). MTF surveys students in the 8th, 10th, and 12th grades in classrooms during the spring of each year, and it also collects data by mail from a subsample of adults who had participated earlier in the study as 12th graders (Johnston, O’Malley, Bachman, & Schulenberg, 2011, 2012). Historically, NSDUH rates of youth substance use have been lower than those of MTF. Occasionally, the two surveys have shown different trends in youth substance use over a short time period, although the two sources of youth behavior have shown very similar long-term trends in prevalence. NSDUH and MTF rates of substance use generally have been similar among young adults, and the two sources also have shown similar trends.
Another source of data on trends in the use of drugs among youths is the Youth Risk Behavior Survey (YRBS), sponsored by the Centers for Disease Control and Prevention (CDC). YRBS surveys students in the 9th through 12th grades in classrooms every other year during the spring (Eaton et al., 2012). The most recent survey was completed in 2011. Generally, the YRBS showed higher prevalence rates but similar trends when compared with NSDUH and MTF. However, comparisons between the YRBS and NSDUH or MTF were less straightforward because of the different periodicity (i.e., biennially instead of annually) and ages covered, the limited number of drug use questions, and smaller sample size in the YRBS.
For the pain reliever and heroin analyses, data from two other studies are discussed. The Treatment Episode Data Set (TEDS) is a SAMHSA study that compiles data on admissions to publicly funded substance abuse treatment centers in the United States. The Drug Abuse Warning Network (DAWN) is a SAMHSA public health surveillance system that, since 2004, has monitored a nationally representative sample of hospitals in the United States for patients’ medical records of emergency department visits that are related to drug use, abuse, and misuse.
Comparison of NSDUH, MTF, and YRBS Trends
A comparison of NSDUH and MTF estimates for 2002 to 2011 is shown in Tables 8.1 through 8.6 at the end of this chapter for several substances that are defined similarly in the two surveys. For comparison purposes, MTF data on 8th and 10th graders are combined to give an age range close to 12 to 17 years, the standard youth age group for NSDUH. Appendix C provides comparisons according to MTF definitions. MTF follow-up data on persons aged 19 to 24 provide the closest match on age to estimates for NSDUH young adults aged 18 to 25. The NSDUH results are remarkably consistent with MTF trends for both youths and young adults, as discussed in the following paragraphs.
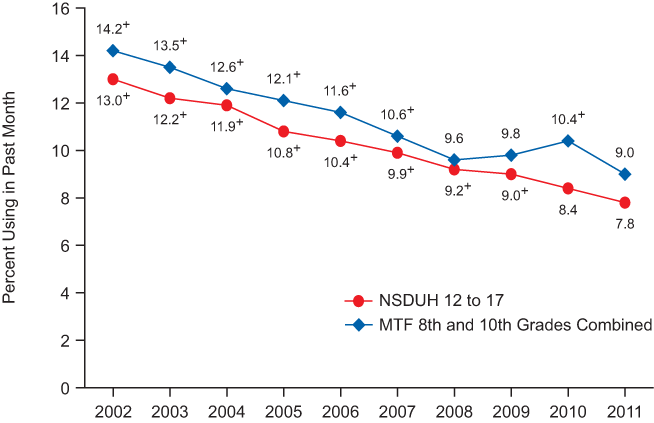
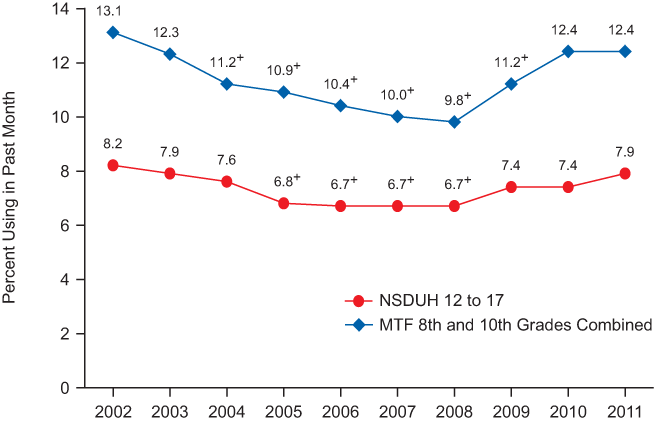
Both surveys showed decreases between 2002 and 2011 in the percentages of youths who used cocaine, inhalants, alcohol, and cigarettes in the past month (Table 8.3). For youth alcohol use, MTF showed a decrease between 2010 and 2011, while NSDUH indicated no significant change. Over the long term, however, the two surveys have shown remarkably consistent trends in alcohol use (Figure 8.1). There have been other instances where the two surveys show differing trends from 1 year to the next, but these discrepancies usually “correct” themselves with 1 or 2 more years of data, pointing to the need to use caution in the interpretation of 1-year shifts in prevalence levels2. For marijuana use, both surveys showed declines from 2002 to 2006 and increases from 2008 to 2011, with the 2011 estimates approaching the respective 2002 levels (Figure 8.3). NSDUH and MTF data showed generally consistent trends for past month use of Ecstasy, with decreases in use from 2002 to the middle of the decade, then increasing use from 2007 to 2010. However, MTF showed a decline in use in 2011, while NSDUH did not. Both surveys indicated little change in past month use of LSD.
Below is a line graph. Click here for the text describing this graph.
Figure 8.1 Past Month Alcohol Use among Youths in NSDUH and MTF: 2002-2011

MTF = Monitoring the Future; NSDUH = National Survey on Drug Use and Health.
+ Difference between this estimate and the 2011 estimate is statistically significant at the .05 level.
Below is a line graph. Click here for the text describing this graph.
Figure 8.2 Past Month Cigarette Use among Youths in NSDUH and MTF: 2002-2011
MTF = Monitoring the Future; NSDUH = National Survey on Drug Use and Health.
+ Difference between this estimate and the 2011 estimate is statistically significant at the .05 level.
Below is a line graph. Click here for the text describing this graph.
Figure 8.3 Past Month Marijuana Use among Youths in NSDUH and MTF: 2002-2011
MTF = Monitoring the Future; NSDUH = National Survey on Drug Use and Health.
+ Difference between this estimate and the 2011 estimate is statistically significant at the .05 level.
NSDUH and MTF also collect data on perceived risk of harm. The extent to which youths believe that substances might cause them harm is an important factor influencing whether or not they will use these substances. Declining levels of perceived risk among youths historically have been associated with subsequent increases in rates of use. Among youths aged 12 to 17, the percentage reporting in NSDUH that they thought there was a great risk of harm in smoking marijuana once or twice a week declined from 54.6 percent in 2007 to 44.8 percent in 2011. MTF data for combined 8th and 10th graders showed a similar decline in perceived great risk of harm of regular marijuana use over this time period, from 69.4 to 61.8 percent.
For the substances for which information on current use was collected in the YRBS, including alcohol, cigarettes, marijuana, and cocaine, the YRBS trend results between 2001 and 2011 were consistent with NSDUH and MTF (see http://www.cdc.gov/HealthyYouth/yrbs/; Grunbaum et al., 2002). YRBS data for the combined grades 9 through 12 showed decreases in past month alcohol use (47.1 percent in 2001 and 38.7 percent in 2011) and cigarette use (28.5 percent in 2001 and 18.1 percent in 2011). YRBS showed a decline in past month marijuana use between 2001 (23.9 percent) and 2007 (19.7 percent), and an increase between 2007 and 2011 (23.1 percent). This increase was consistent with the recent NSDUH and MTF increases since 2007.
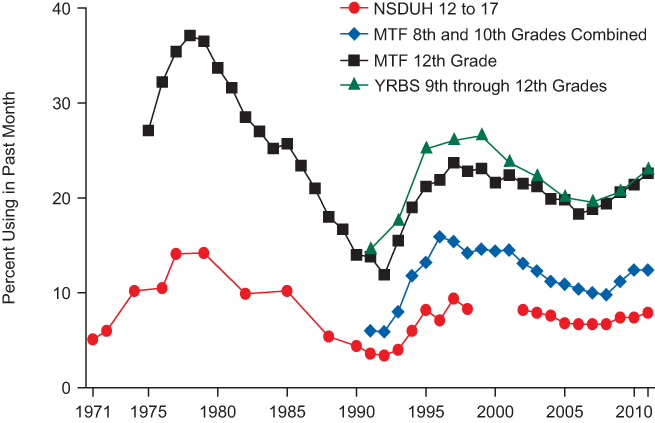
Although changes in NSDUH survey methodology preclude direct comparisons of recent estimates with estimates from before 2002, it is important to put the recent trends in context by reviewing longer term trends in use. NSDUH data (prior to the design changes in 1999 and 2002) on youths aged 12 to 17 and MTF data on high school seniors showed substantial increases in youth illicit drug use during the 1970s, reaching a peak in the late 1970s. Both surveys then showed declines throughout the 1980s until about 1992, when rates reached a low point. These trends were driven by the trend in marijuana use. With the start of annual data collection in NSDUH in 1991, along with the biennial YRBS and the annual 8th and 10th grade samples in MTF, trends among youths are well documented since the low point that occurred in the early 1990s. Although they employ different survey designs and cover different age groups, the three surveys are consistent in showing increasing rates of marijuana use during the early to mid-1990s, reaching a peak in the late 1990s (but lower than in the late 1970s). This peak in the late 1990s was followed by declines in use after the turn of the 21st century and an increase in the most recent years (Figure 8.4).
Below is a line graph. Click here for the text describing this graph.
Figure 8.4 Past Month Marijuana Use among Youths in NSDUH, MTF, and YRBS: 1971-2011
MTF = Monitoring the Future; NSDUH = National Survey on Drug Use and Health; YRBS = Youth Risk Behavior Survey.
Note: NSDUH data for youths aged 12 to 17 are not presented for 1999 to 2001 because of design changes in the survey. These design changes preclude direct comparisons of estimates from 2002 to 2011 with estimates prior to 1999.
Data on young adults also showed similar trends in NSDUH and MTF, although not as consistent as for the youth data (Tables 8.4 to 8.6). Potential reasons for differences from the data for youths are the relatively smaller MTF sample size for young adults and possible bias in the MTF sample due to noncoverage of school dropouts and a low overall response rate; the response rate is affected by nonresponse by schools, by students in the 12th grade survey, and by students in the follow-up mail survey.
Both surveys showed an increase in past month marijuana use among young adults from 2008 to 2011 (16.6 to 19.0 percent in NSDUH; 17.3 to 20.1 percent in MTF) (Table 8.6). Both surveys showed declines in cigarette use between 2002 and 2011, with NSDUH showing a decline from 40.8 to 33.5 percent and MTF showing a decline from 31.4 to 21.3 percent. There was no significant change between 2002 and 2011 in the rate of current alcohol use among young adults in either survey. Both surveys showed declines in past year and past month cocaine use from 2002 to 2011, with no changes in rates between 2010 and 2011 (Tables 8.5 and 8.6, respectively). Similarly, past year and past month Ecstasy use among young adults increased between 2007 and 2010 and remained steady in 2011, according to both NSDUH and MTF.
Nonmedical Use of Prescription Pain Relievers
As noted in Chapter 2 of this report, NSDUH data indicated that nonmedical use of prescription drugs among youths aged 12 to 17 and young adults aged 18 to 25 in 2011 was the second most prevalent illicit drug use category, with marijuana being first. NSDUH data showed a decline in past month nonmedical prescription drug use among youths between 2002 (4.0 percent) and 2008 (2.9 percent), with no significant change between 2008 and 2011 (2.8 percent). Among young adults aged 18 to 25, past month prevalence of nonmedical prescription drug use was 5.0 percent in 2011. This prevalence in 2011 was lower than the rates in other years since 2003, which varied between 5.9 and 6.5 percent. The most prevalent category of misused prescription drugs is pain relievers. Nonmedical pain reliever use in the past month among youths declined from 3.2 percent in 2002 to 2.3 percent in 2011, while the rate among young adults was lower in 2011 (3.6 percent) than in 2010 (4.4 percent) as well as in years from 2002 to 2009 (between 4.1 and 5.0 percent).
NSDUH and MTF use different definitions and questioning strategies to track misuse of prescription drugs. For example, NSDUH defines misuse as use of prescription drugs that were not prescribed for the respondent or use of these drugs only for the experience or feeling they caused; MTF defines misuse as use not under a doctor’s orders. MTF also does not estimate overall prescription drug misuse. However, MTF asks questions about “narcotics other than heroin,” a category similar in coverage to the pain reliever category in NSDUH. These data are reported for 12th graders and for young adults. In addition, as is the case with NSDUH trends, methodological changes in MTF have sometimes resulted in discontinuities. For the data on use of narcotics other than heroin, there was a questionnaire change in the 2002 MTF that resulted in increased reporting of opiates, such that estimates prior to 2002 are not strictly comparable with estimates for 2002 and beyond.
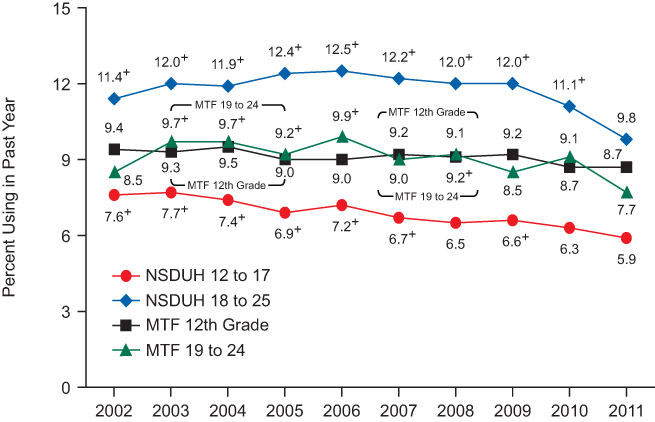
Figure 8.5 shows NSDUH data for past year misuse of pain relievers from 2002 to 2011 for youths aged 12 to 17 and young adults aged 18 to 25 (comparable estimates for prior years are not available). MTF data for 12th graders and young adults (aged 19 to 24) are shown for past year misuse of narcotics other than heroin since 2002. Except for 12th graders in MTF, both surveys showed declines from 2006 to 2011 in the prevalence of past year misuse of pain relievers/narcotics other than heroin. Among youths (NSDUH only), the rate of past year use declined from 7.2 to 5.9 percent. Among young adults, NSDUH showed a decline from 12.5 to 9.8 percent, while MTF showed a decline from 9.9 to 7.7 percent (Table 8.5). MTF estimates for 12th graders were similar between 2006 and 2011 (9.0 and 8.7 percent). However, the pattern of estimates for 12th graders in MTF between 2006 and 2011 was in the same direction as those for youths in NSDUH and young adults in both surveys.
Below is a line graph. Click here for the text describing this graph.
Figure 8.5 Past Year Nonmedical Pain Reliever Use among Youths and Young Adults in NSDUH and MTF: 2002-2011
MTF = Monitoring the Future; NSDUH = National Survey on Drug Use and Health.
Note: Data for MTF are for “narcotics other than heroin.”
+ Difference between this estimate and the 2011 estimate is statistically significant at the .05 level.
Although the focus of attention is primarily on drug use among young people, NSDUH data demonstrate that the majority (57 percent) of past year nonmedical pain reliever users were aged 26 or older in 2011. Among this age group, the percentage that had used pain relievers nonmedically in the past 12 months rose from 3.1 percent in 2002 to 3.6 percent in 2006 and 2007, then declined to 3.2 percent in 2011.
These data generally indicate a decline in nonmedical pain reliever use from 2002 to 2011. However, other trends indicate a growing problem. According to NSDUH, initiation rates for nonmedical pain reliever use, although declining, were second to initiation rates for marijuana in 2010 and 2011 and were similar to or greater than marijuana initiation rates in 2002 to 2009. There have been 1.9 million or more new nonmedical pain reliever users each year since 2002. The sustained numbers of new and continuing users have contributed to increases in indicators of problems associated with use, especially among adults. The number of persons with nonmedical pain reliever dependence increased from 936,000 in 2002 to 1.4 million in 2011. An estimated 56.1 percent of these pain reliever-dependent persons in 2011 were aged 26 or older, but about one third (472,000) were aged 18 to 25. The number of persons receiving specialty substance abuse treatment within the past year for misuse of pain relievers increased during this period, from 199,000 to 438,000. In 2011, 63.7 percent of those receiving specialty substance abuse treatment for pain relievers were aged 26 or older, and 29.6 percent were aged 18 to 25. TEDS and DAWN data confirm these trends. Special analyses of TEDS admissions data indicate that admissions to publicly funded substance abuse treatment programs for a nonheroin opiate problem increased from 91,000 in 2002 to 259,000 in 2010; in 2010, 69 percent of such admissions were aged 25 or older, and 28 percent were aged 18 to 24. According to DAWN data, the number of emergency department visits involving nonmedical use of narcotic pain relievers increased from 145,000 in 2004 to 360,000 in 2010 (Center for Behavioral Health Statistics and Quality, 2012).
Heroin Use
Chapters 2 and 5 of this report note that the 2011 NSDUH data showed higher numbers of heroin users and initiates than in some prior years. These findings seem to support anecdotal reports that have suggested increasing use of heroin among young people. For example, news media reports have linked the increase in heroin use to nonmedical use of prescription pain relievers among young people, suggesting that some prescription pain reliever abusers have shifted to heroin. It is not possible in this summary report of the 2011 NSDUH findings to fully explore the potential association between pain reliever misuse and heroin use. In addition, a limitation of NSDUH and other household surveys is the difficulty in estimating heroin use prevalence because of the low prevalence of use in the general population, the likelihood of underreporting of use, and undercoverage of heroin users in a household sample. Nevertheless, despite the underestimation that is believed to be present, NSDUH’s consistent methodology over time permits assessment of trends, providing an important baseline and descriptive background for studying the recent heroin problem. To provide stable estimates for assessing trends, a comparison of combined 2002-2005 estimates with 2009-2011 estimates is made.
Figure 8.6 shows the estimated annual numbers of past year heroin users, persons with past year heroin dependence, and first-time users (past year initiates) from 2002 to 2011. Numbers of past year heroin users and persons with heroin dependence increased from 2002 to 2011, and the number of past year initiates increased from 2003 to 2011. Estimates of the number of users for 2009, 2010, and 2011 yielded an annual average of 607,000 per year, compared with an annual average of 374,000 during 2002-2005. Similarly, the estimated number of new users increased from 109,000 per year during 2002-2005 to 169,000 per year during 2009-2011. The increase in initiation is evident among young adults aged 18 to 25 and adults aged 26 and older. There were 28,000 youth initiates per year in 2002-2005 and 27,000 in 2009-2011. Young adult initiates increased from 53,000 per year to 89,000 per year, and older adult initiates increased from 28,000 to 54,000 for these combined time periods. Past year use estimates for 2002-2005 and 2009-2011 showed the same pattern: for youths, estimates were 43,000 and 39,000; for young adults, the estimates were 124,000 and 208,000; and for older adults, the estimates were 207,000 and 361,000. MTF data indicated an increase for young adults aged 19 to 28 and a decrease for 10th graders in rates of past year heroin use between 2002 and 2011. MTF data did not indicate any changes among 8th and 12th graders between these 2 years.
Below is a line graph. Click here for the text describing this graph.
Figure 8.6 Past Year Heroin Use, Heroin Dependence, and Heroin Initiates among Persons Aged 12 or Older: 2002-2011
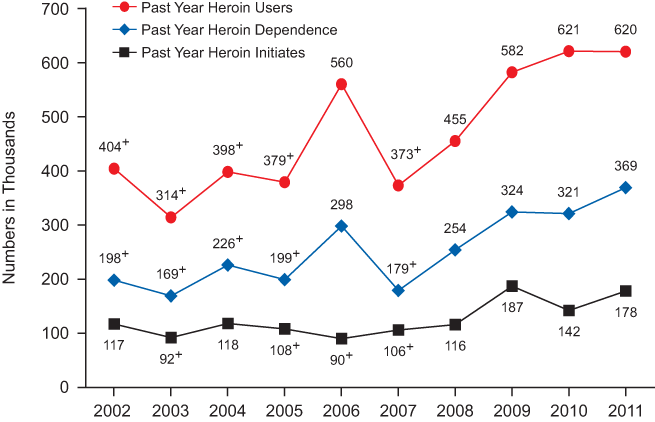
+ Difference between this estimate and the 2011 estimate is statistically significant at the .05 level.
NSDUH has consistently found that about half or more of past year heroin users are dependent on heroin. Thus, it is not surprising that the number of persons with heroin dependence has risen along with the number of users. The average annual number of persons with heroin dependence increased from 198,000 per year during 2002-2005 to 338,000 during 2009-2011. The majority of these heroin-dependent persons were aged 26 or older. However, the annual average number of heroin-dependent young adults rose from 53,000 in 2002-2005 to 109,000 in 2009-2011. The annual average number of older adults who were dependent on heroin increased from 137,000 to 216,000 between these two periods. Youth heroin dependence estimates were 8,000 and 13,000, respectively.
Finally, the NSDUH estimated annual average number of persons receiving treatment in the past year for a heroin problem at a specialty substance abuse facility increased from 181,000 during 2002-2005 to 289,000 during 2009-2011. However, this increase in treatment for heroin is not evident in TEDS data from publicly funded treatment programs. Special analyses of TEDS admissions data indicated that there were 340,000 admissions for a heroin problem in 2002 and 314,000 in 2010. This decline could be associated with an increase in private-for-profit opioid treatment facilities during the past few years. Most of these private facilities are not included in TEDS data. There was also no increase in heroin-related emergency department visits according to DAWN results. DAWN estimated that there were 214,000 visits in 2004 and 225,000 in 2010 (CBHSQ, 2012). These apparently inconsistent findings based on data from service providers need further study.
| Substance/Survey | 2002 | 2003 | 2004 | 2005 | 2006 | 2007 | 2008 | 2009 | 2010 | 2011 |
|---|---|---|---|---|---|---|---|---|---|---|
| MTF = Monitoring the Future; NSDUH = National Survey on Drug Use and Health. NOTE: NSDUH data are for youths aged 12 to 17. Some 2006 to 2010 NSDUH estimates may differ from previously published estimates due to updates (see Section B.3 in Appendix B of this report). NOTE: MTF data are simple averages of estimates for 8th and 10th graders. MTF data for 8th and 10th graders are reported in Johnston, O’Malley, Bachman, and Schulenberg (2012), as are the MTF design effects used for variance estimation. a Difference between this estimate and 2011 estimate is statistically significant at the .05 level. Sources: SAMHSA, Center for Behavioral Health Statistics and Quality, National Survey on Drug Use and Health, 2002-2011. National Institute on Drug Abuse, Monitoring the Future Study, University of Michigan, 2002-2011. |
||||||||||
| Marijuana |
||||||||||
| NSDUH | 20.6a | 19.6a | 19.0a | 17.4 | 17.3 | 16.2a | 16.6 | 17.1 | 17.1 | 17.5 |
| MTF | 29.0a | 27.0 | 25.7 | 25.3 | 23.8 | 22.6a | 22.3a | 24.0 | 25.4 | 25.5 |
| Cocaine | ||||||||||
| NSDUH | 2.7a | 2.6a | 2.4a | 2.3a | 2.2a | 2.2a | 1.9a | 1.6 | 1.5 | 1.3 |
| MTF | 4.9a | 4.4a | 4.4a | 4.5a | 4.1a | 4.2a | 3.8a | 3.6a | 3.2a | 2.8 |
| Ecstasy | ||||||||||
| NSDUH | 3.3a | 2.4 | 2.1 | 1.6a | 1.9a | 1.8a | 2.1 | 2.3 | 2.5 | 2.4 |
| MTF | 5.5a | 4.3 | 3.6a | 3.4a | 3.5a | 3.8a | 3.4a | 3.9 | 4.9 | 4.6 |
| LSD | ||||||||||
| NSDUH | 2.7a | 1.6a | 1.2a | 1.1 | 0.9 | 0.8 | 1.1 | 1.0 | 0.9 | 0.9 |
| MTF | 3.8a | 2.8 | 2.3 | 2.2 | 2.2 | 2.3 | 2.3 | 2.4 | 2.4 | 2.3 |
| Inhalants | ||||||||||
| NSDUH | 10.5a | 10.7a | 11.0a | 10.5a | 10.1a | 9.6a | 9.3a | 9.3a | 8.3a | 7.5 |
| MTF | 14.4a | 14.3a | 14.9a | 15.1a | 14.7a | 14.6a | 14.3a | 13.6a | 13.3a | 11.6 |
| Alcohol | ||||||||||
| NSDUH | 43.4a | 42.9a | 42.0a | 40.6a | 40.4a | 39.5a | 38.6a | 38.4a | 35.4 | 34.5 |
| MTF | 57.0a | 55.8a | 54.1a | 52.1a | 51.0a | 50.3a | 48.6a | 47.9a | 47.0a | 44.6 |
| Cigarettes | ||||||||||
| NSDUH | 33.3a | 31.0a | 29.2a | 26.7a | 25.9a | 23.7a | 23.1a | 22.3a | 20.5a | 19.1 |
| MTF | 39.4a | 35.7a | 34.3a | 32.4a | 30.4a | 28.4a | 26.1a | 26.4a | 26.5a | 24.4 |
| Substance/Survey | 2002 | 2003 | 2004 | 2005 | 2006 | 2007 | 2008 | 2009 | 2010 | 2011 |
|---|---|---|---|---|---|---|---|---|---|---|
| MTF = Monitoring the Future; NSDUH = National Survey on Drug Use and Health. — Not available. NOTE: NSDUH data are for youths aged 12 to 17. Some 2006 to 2010 NSDUH estimates may differ from previously published estimates due to updates (see Section B.3 in Appendix B of this report). NOTE: MTF data are simple averages of estimates for 8th and 10th graders. MTF data for 8th and 10th graders are reported in Johnston, O’Malley, Bachman, and Schulenberg (2012), as are the MTF design effects used for variance estimation. a Difference between this estimate and 2011 estimate is statistically significant at the .05 level. Sources: SAMHSA, Center for Behavioral Health Statistics and Quality, National Survey on Drug Use and Health, 2002-2011. National Institute on Drug Abuse, Monitoring the Future Study, University of Michigan, 2002-2011. |
||||||||||
| Marijuana | ||||||||||
| NSDUH | 15.8a | 15.0 | 14.5 | 13.3a | 13.2a | 12.5a | 13.1a | 13.7 | 14.0 | 14.2 |
| MTF | 22.5a | 20.5 | 19.7 | 19.4 | 18.5a | 17.5a | 17.4a | 19.3 | 20.6 | 20.7 |
| Cocaine | ||||||||||
| NSDUH | 2.1a | 1.8a | 1.6a | 1.7a | 1.6a | 1.5a | 1.2a | 1.0 | 1.0 | 0.9 |
| MTF | 3.2a | 2.8a | 2.9a | 2.9a | 2.6a | 2.7a | 2.4a | 2.2a | 1.9 | 1.7 |
| Ecstasy | ||||||||||
| NSDUH | 2.2a | 1.3a | 1.2a | 1.0a | 1.2a | 1.3a | 1.4 | 1.7 | 1.9 | 1.7 |
| MTF | 3.9a | 2.6 | 2.1a | 2.2a | 2.1a | 2.5a | 2.3a | 2.5a | 3.6 | 3.1 |
| LSD | ||||||||||
| NSDUH | 1.3a | 0.6 | 0.6 | 0.6 | 0.4a | 0.5 | 0.7 | 0.6 | 0.6 | 0.6 |
| MTF | 2.1a | 1.5 | 1.4 | 1.4 | 1.3 | 1.5 | 1.6 | 1.5 | 1.6 | 1.5 |
| Inhalants | ||||||||||
| NSDUH | 4.4a | 4.5a | 4.6a | 4.5a | 4.4a | 3.9a | 4.0a | 3.9a | 3.6 | 3.3 |
| MTF | 6.8a | 7.1a | 7.8a | 7.8a | 7.8a | 7.5a | 7.4a | 7.1a | 6.9a | 5.8 |
| Alcohol | ||||||||||
| NSDUH | 34.6a | 34.3a | 33.9a | 33.3a | 33.0a | 31.9a | 31.0a | 30.5a | 28.7 | 27.8 |
| MTF | 49.4a | 48.3a | 47.5a | 45.3a | 44.7a | 44.1a | 42.3a | 41.6a | 40.7a | 38.4 |
| Cigarettes | ||||||||||
| NSDUH | 20.3a | 19.0a | 18.4a | 17.3a | 17.0a | 15.7a | 15.1a | 15.1a | 14.2a | 13.2 |
| MTF | — | — | — | — | — | — | — | — | — | — |
| Substance/Survey | 2002 | 2003 | 2004 | 2005 | 2006 | 2007 | 2008 | 2009 | 2010 | 2011 |
|---|---|---|---|---|---|---|---|---|---|---|
| MTF = Monitoring the Future; NSDUH = National Survey on Drug Use and Health. NOTE: NSDUH data are for youths aged 12 to 17. Some 2006 to 2010 NSDUH estimates may differ from previously published estimates due to updates (see Section B.3 in Appendix B of this report). NOTE: MTF data are simple averages of estimates for 8th and 10th graders. MTF data for 8th and 10th graders are reported in Johnston, O’Malley, Bachman, and Schulenberg (2012), as are the MTF design effects used for variance estimation. a Difference between this estimate and 2011 estimate is statistically significant at the .05 level. Sources: SAMHSA, Center for Behavioral Health Statistics and Quality, National Survey on Drug Use and Health, 2002-2011. National Institute on Drug Abuse, Monitoring the Future Study, University of Michigan, 2002-2011. |
||||||||||
| Marijuana | ||||||||||
| NSDUH | 8.2 | 7.9 | 7.6 | 6.8a | 6.7a | 6.7a | 6.7a | 7.4 | 7.4 | 7.9 |
| MTF | 13.1 | 12.3 | 11.2a | 10.9a | 10.4a | 10.0a | 9.8a | 11.2a | 12.4 | 12.4 |
| Cocaine | ||||||||||
| NSDUH | 0.6a | 0.6a | 0.5a | 0.6a | 0.4a | 0.4a | 0.4 | 0.3 | 0.2 | 0.3 |
| MTF | 1.4a | 1.1a | 1.3a | 1.3a | 1.3a | 1.1a | 1.0 | 0.9 | 0.8 | 0.8 |
| Ecstasy | ||||||||||
| NSDUH | 0.5 | 0.4 | 0.3 | 0.3 | 0.3 | 0.3a | 0.4 | 0.5 | 0.5 | 0.4 |
| MTF | 1.6a | 0.9 | 0.8a | 0.8a | 1.0 | 0.9 | 1.0 | 1.0 | 1.5a | 1.1 |
| LSD | ||||||||||
| NSDUH | 0.2 | 0.2 | 0.2 | 0.1 | 0.1 | 0.1 | 0.2 | 0.1 | 0.2 | 0.1 |
| MTF | 0.7 | 0.6 | 0.6 | 0.6 | 0.6 | 0.6 | 0.6 | 0.5 | 0.7 | 0.6 |
| Inhalants | ||||||||||
| NSDUH | 1.2a | 1.3a | 1.2a | 1.2a | 1.3a | 1.2a | 1.1 | 1.0 | 1.1 | 0.9 |
| MTF | 3.1a | 3.2a | 3.5a | 3.2a | 3.2a | 3.2a | 3.1a | 3.0a | 2.8 | 2.5 |
| Alcohol | ||||||||||
| NSDUH | 17.6a | 17.7a | 17.6a | 16.5a | 16.7a | 16.0a | 14.7a | 14.8a | 13.6 | 13.3 |
| MTF | 27.5a | 27.6a | 26.9a | 25.2a | 25.5a | 24.7a | 22.4a | 22.7a | 21.4a | 20.0 |
| Cigarettes | ||||||||||
| NSDUH | 13.0a | 12.2a | 11.9a | 10.8a | 10.4a | 9.9a | 9.2a | 9.0a | 8.4 | 7.8 |
| MTF | 14.2a | 13.5a | 12.6a | 12.1a | 11.6a | 10.6a | 9.6 | 9.8 | 10.4a | 9.0 |
| Substance/Survey | 2002 | 2003 | 2004 | 2005 | 2006 | 2007 | 2008 | 2009 | 2010 | 2011 |
|---|---|---|---|---|---|---|---|---|---|---|
| MTF = Monitoring the Future; NSDUH = National Survey on Drug Use and Health. — Not available. NOTE: NSDUH data are for persons aged 18 to 25. Some 2006 to 2010 NSDUH estimates may differ from previously published estimates due to updates (see Section B.3 in Appendix B of this report). NOTE: MTF data were calculated for persons aged 19 to 24 using simple averages of modal age groups 19-20, 21-22, and 23-24 (source data at http://www.monitoringthefuture.org/pubs.html). Estimates may differ from those published previously due to rounding. For the 19 to 24 age group in the MTF data, significance tests were performed assuming independent samples between years an odd number of years apart because two distinct cohorts a year apart were monitored longitudinally at 2-year intervals. Although appropriate for comparisons of 2002, 2004, 2006, 2008, and 2010 estimates with 2011 estimates, this assumption results in conservative tests for comparisons of 2003, 2005, 2007, and 2009 data with 2011 estimates because it does not take into account covariances that are associated with repeated observations from the longitudinal samples. Estimates of covariances were not available. a Difference between this estimate and 2011 estimate is statistically significant at the .05 level. 1 MTF data are for “narcotics other than heroin.” Sources: SAMHSA, Center for Behavioral Health Statistics and Quality, National Survey on Drug Use and Health, 2002-2011. National Institute on Drug Abuse, Monitoring the Future Study, University of Michigan, 2002-2011. |
||||||||||
| Marijuana | ||||||||||
| NSDUH | 53.8a | 53.9a | 52.8 | 52.4 | 52.5 | 50.9 | 50.8 | 52.6 | 51.4 | 51.9 |
| MTF | 56.1a | 56.4a | 55.6a | 54.4 | 53.8 | 53.9 | 53.0 | 53.8 | 53.2 | 53.1 |
| Cocaine | ||||||||||
| NSDUH | 15.4a | 15.0a | 15.2a | 15.1a | 15.7a | 15.0a | 14.5a | 14.9a | 13.4a | 12.4 |
| MTF | 12.9a | 14.5a | 14.3a | 12.6a | 13.6a | 12.4a | 12.2a | 12.2a | 10.9 | 10.3 |
| Ecstasy | ||||||||||
| NSDUH | 15.1a | 14.8a | 13.8a | 13.7a | 13.4a | 12.8 | 12.2 | 12.5 | 12.4 | 12.3 |
| MTF | 16.0a | 16.6a | 14.9a | 12.4a | 11.5 | 9.5 | 10.1 | 9.3 | 10.2 | 9.9 |
| LSD | ||||||||||
| NSDUH | 15.9a | 14.0a | 12.1a | 10.5a | 9.0a | 7.3a | 6.6 | 6.9a | 6.4 | 6.0 |
| MTF | 13.9a | 13.8a | 10.4a | 7.9a | 6.7a | 5.9 | 5.6 | 5.3 | 5.7 | 5.4 |
| Inhalants | ||||||||||
| NSDUH | 15.7a | 14.9a | 14.0a | 13.3a | 12.5a | 11.3a | 10.5a | 10.8a | 10.0a | 9.1 |
| MTF | 11.7a | 11.4a | 10.6a | 9.3a | 9.7a | 7.5 | 8.4a | 7.7 | 6.8 | 6.0 |
| Alcohol | ||||||||||
| NSDUH | 86.7a | 87.1a | 86.2a | 85.7a | 86.5a | 85.2 | 85.6a | 85.8a | 85.7a | 84.3 |
| MTF | 88.4a | 87.6a | 87.2a | 87.1a | 87.0a | 86.0 | 86.4a | 85.7 | 84.9 | 84.4 |
| Cigarettes | ||||||||||
| NSDUH | 71.2a | 70.2a | 68.7a | 67.3a | 66.6a | 64.8a | 64.4a | 63.8a | 62.3 | 61.0 |
| MTF | — | — | — | — | — | — | — | — | — | — |
| Pain Relievers1 | ||||||||||
| NSDUH | 22.1 | 23.7a | 24.3a | 25.5a | 25.5a | 24.9a | 24.6a | 24.5a | 23.9a | 22.2 |
| MTF | — | 17.3 | 17.7 | 16.9 | 17.9a | 17.8 | 17.8 | 17.2 | 16.6 | 16.0 |
| Substance/Survey | 2002 | 2003 | 2004 | 2005 | 2006 | 2007 | 2008 | 2009 | 2010 | 2011 |
|---|---|---|---|---|---|---|---|---|---|---|
| MTF = Monitoring the Future; NSDUH = National Survey on Drug Use and Health. NOTE: NSDUH data are for persons aged 18 to 25. Some 2006 to 2010 NSDUH estimates may differ from previously published estimates due to updates (see Section B.3 in Appendix B of this report). NOTE: MTF data were calculated for persons aged 19 to 24 using simple averages of modal age groups 19-20, 21-22, and 23-24 (source data at http://www.monitoringthefuture.org/pubs.html). Estimates may differ from those published previously due to rounding. For the 19 to 24 age group in the MTF data, significance tests were performed assuming independent samples between years an odd number of years apart because two distinct cohorts a year apart were monitored longitudinally at 2-year intervals. Although appropriate for comparisons of 2002, 2004, 2006, 2008, and 2010 estimates with 2011 estimates, this assumption results in conservative tests for comparisons of 2003, 2005, 2007, and 2009 data with 2011 estimates because it does not take into account covariances that are associated with repeated observations from the longitudinal samples. Estimates of covariances were not available. a Difference between this estimate and 2011 estimate is statistically significant at the .05 level. 1 MTF data are for “narcotics other than heroin.” In 2002, MTF question text was changed in half of the sample by updating the example list of narcotics other than heroin. To be consistent with MTF data for 2003 and later years, MTF data for 2002 past year use of narcotics other than heroin are based on the half sample that received the new question text. Sources: SAMHSA, Center for Behavioral Health Statistics and Quality, National Survey on Drug Use and Health, 2002-2011. National Institute on Drug Abuse, Monitoring the Future Study, University of Michigan, 2002-2011. |
||||||||||
| Marijuana | ||||||||||
| NSDUH | 29.8 | 28.5a | 27.8a | 28.0a | 28.1a | 27.5a | 27.8a | 30.8 | 30.0 | 30.8 |
| MTF | 34.2 | 33.0 | 31.6 | 31.4 | 30.9a | 31.0a | 30.9a | 32.2 | 31.7 | 33.7 |
| Cocaine | ||||||||||
| NSDUH | 6.7a | 6.6a | 6.6a | 6.9a | 6.9a | 6.4a | 5.6a | 5.3a | 4.7 | 4.6 |
| MTF | 6.5a | 7.3a | 7.8a | 6.9a | 7.0a | 6.3a | 6.0a | 5.7 | 4.7 | 4.8 |
| Ecstasy | ||||||||||
| NSDUH | 5.8a | 3.7 | 3.1a | 3.1a | 3.8 | 3.5a | 3.9 | 4.3 | 4.4 | 4.1 |
| MTF | 8.0a | 5.3 | 3.3 | 3.4 | 3.6 | 2.8a | 3.8 | 3.5 | 4.7 | 4.4 |
| LSD | ||||||||||
| NSDUH | 1.8 | 1.1a | 1.0a | 1.0a | 1.2a | 1.1a | 1.5 | 1.6 | 1.6 | 1.7 |
| MTF | 2.4 | 1.5a | 1.2a | 1.1a | 1.5 | 1.4a | 1.9 | 2.1 | 1.8 | 2.2 |
| Inhalants | ||||||||||
| NSDUH | 2.2a | 2.1a | 2.1a | 2.1a | 1.8 | 1.6 | 1.6 | 1.9a | 1.8 | 1.5 |
| MTF | 2.2a | 1.5 | 2.3a | 1.6 | 1.8a | 1.1 | 1.7 | 1.2 | 1.7 | 0.9 |
| Alcohol | ||||||||||
| NSDUH | 77.9 | 78.1 | 78.0 | 77.9 | 78.8a | 77.9 | 78.0 | 78.7a | 78.6a | 77.0 |
| MTF | 83.9a | 82.3 | 83.1a | 82.8a | 83.2a | 82.8a | 82.5 | 82.0 | 80.5 | 80.6 |
| Cigarettes | ||||||||||
| NSDUH | 49.0a | 47.6a | 47.5a | 47.2a | 47.0a | 45.2a | 45.1a | 45.3a | 43.2 | 42.3 |
| MTF | 41.8a | 40.8a | 41.4a | 40.2a | 37.1a | 36.2a | 35.4a | 35.0a | 33.0 | 32.6 |
| Pain Relievers1 |
||||||||||
| NSDUH | 11.4a | 12.0a | 11.9a | 12.4a | 12.5a | 12.2a | 12.0a | 12.0a | 11.1a | 9.8 |
| MTF | 8.5 | 9.7a | 9.7a | 9.2a | 9.9a | 9.0 | 9.2a | 8.5 | 9.1 | 7.7 |
| Substance/Survey | 2002 | 2003 | 2004 | 2005 | 2006 | 2007 | 2008 | 2009 | 2010 | 2011 |
|---|---|---|---|---|---|---|---|---|---|---|
| MTF = Monitoring the Future; NSDUH = National Survey on Drug Use and Health. — Not available. NOTE: NSDUH data are for persons aged 18 to 25. Some 2006 to 2010 NSDUH estimates may differ from previously published estimates due to updates (see Section B.3 in Appendix B of this report). NOTE: MTF data were calculated for persons aged 19 to 24 using simple averages of modal age groups 19-20, 21-22, and 23-24 (source data at http://www.monitoringthefuture.org/pubs.html). Estimates may differ from those published previously due to rounding. For the 19 to 24 age group in the MTF data, significance tests were performed assuming independent samples between years an odd number of years apart because two distinct cohorts a year apart were monitored longitudinally at 2-year intervals. Although appropriate for comparisons of 2002, 2004, 2006, 2008, and 2010 estimates with 2011 estimates, this assumption results in conservative tests for comparisons of 2003, 2005, 2007, and 2009 data with 2011 estimates because it does not take into account covariances that are associated with repeated observations from the longitudinal samples. Estimates of covariances were not available. a Difference between this estimate and 2011 estimate is statistically significant at the .05 level. 1 MTF data are for “narcotics other than heroin.” Sources: SAMHSA, Center for Behavioral Health Statistics and Quality, National Survey on Drug Use and Health, 2002-2011. National Institute on Drug Abuse, Monitoring the Future Study, University of Michigan, 2002-2011. |
||||||||||
| Marijuana | ||||||||||
| NSDUH | 17.3a | 17.0a | 16.1a | 16.6a | 16.3a | 16.5a | 16.6a | 18.2 | 18.5 | 19.0 |
| MTF | 19.8 | 19.9 | 18.2a | 17.0a | 17.0a | 17.5a | 17.3a | 18.5 | 17.8a | 20.1 |
| Cocaine | ||||||||||
| NSDUH | 2.0a | 2.2a | 2.1a | 2.6a | 2.2a | 1.7a | 1.6 | 1.4 | 1.5 | 1.4 |
| MTF | 2.5a | 2.6a | 2.4a | 2.1 | 2.4a | 1.9 | 1.9 | 1.8 | 1.5 | 1.5 |
| Ecstasy | ||||||||||
| NSDUH | 1.1 | 0.7 | 0.7 | 0.8 | 1.0 | 0.7 | 0.9 | 1.1 | 1.2 | 0.9 |
| MTF | 1.6 | 1.0 | 0.8 | 0.6 | 0.9 | 0.3 | 0.9 | 0.7 | 1.2 | 0.9 |
| LSD | ||||||||||
| NSDUH | 0.1a | 0.2 | 0.3 | 0.2 | 0.2 | 0.2 | 0.3 | 0.3 | 0.3 | 0.3 |
| MTF | 0.4 | 0.2a | 0.2a | 0.2a | 0.3 | 0.3 | 0.5 | 0.3 | 0.5 | 0.5 |
| Inhalants | ||||||||||
| NSDUH | 0.5 | 0.4 | 0.4 | 0.5 | 0.4 | 0.4 | 0.3 | 0.4 | 0.4 | 0.4 |
| MTF | 0.8a | 0.3 | 0.4 | 0.3 | 0.4 | 0.3 | 0.6 | 0.2 | 0.2 | 0.2 |
| Alcohol | ||||||||||
| NSDUH | 60.5 | 61.4 | 60.5 | 60.9 | 62.0 | 61.3 | 61.1 | 61.8 | 61.4 | 60.7 |
| MTF | 67.7 | 66.3 | 67.3 | 66.8 | 67.0 | 67.4 | 67.4 | 68.1 | 65.8 | 65.8 |
| Cigarettes | ||||||||||
| NSDUH | 40.8a | 40.2a | 39.5a | 39.0a | 38.5a | 36.2a | 35.7a | 35.8a | 34.3 | 33.5 |
| MTF | 31.4a | 29.5a | 30.2a | 28.7a | 26.7a | 25.7a | 24.3a | 23.5a | 21.8 | 21.3 |
| Pain Relievers1 |
||||||||||
| NSDUH | 4.1a | 4.7a | 4.7a | 4.7a | 5.0a | 4.6a | 4.5a | 4.8a | 4.4a | 3.6 |
| MTF | — | 3.4 | 3.4 | 3.7 | 3.6 | 3.5 | 3.7 | 3.2 | 3.5 | 2.9 |